Wednesday 10th March, 2021
Summary
I am selling out of Playtech because I have found evidence to suggest Playtech’s core business-to-business (B2B) software product, “IMS”, is not as powerful in increasing the revenues of its online customers as I previously thought.
Background
I bought shares in Playtech in April and July 2020 at an average price of £1.94. The investment thesis underlying the purchase was based on two key results materializing over time:
- Playtech’s “core” B2B business (excluding B2B revenues from Asia) would grow at 7% CAGR over the next five years as a result of the strength of Playtech’s value proposition to gambling operators; both, reducing costs and increasing revenues for them.
- Playtech’s Italian business, Snaitech, benefiting from Playtech’s powerful IMS technology would drive 15% CAGR in Snaitech’s online offering and thus enable 7% CAGR of cash flows in the Snaitech business overall.
In both cases, the investment case relies heavily on the fact that Playtech’s technology is superior to competing offerings in the market. A fact that Playtech management reiterates at every chance they get – annual reports and regulatory filings are littered with affirmations of Playtech being “the leading technology company in the gambling industry”.
Why did I initially believe Playtech’s technology was actually great?
The evidence I based this judgement on came in the form of a few separate data points:
- The idea that they had collected specific player data over the past 20 years and that this could be used to target players with specific bets (and thereby increase operator revenues) made intuitive sense to me.
- In discussions with Playtech’s investor relations team they described this ability as being analogous to “how Netflix recommends videos to you” (a vivid image, which powerfully secured itself in my decision making).
- Headline data points supported the fact that Playtech’s B2B business was growing in line with global online gross gambling revenues (GGRs).
- When William Hill tried to move off Playtech’s platform in 2014 their revenues plummeted and they signed back up with Playtech in 2016
- After GVC acquired Ladbrokes-Coral in March 2018, and weighed up the benefits of moving L-C off Playtech’s technology, they decided against it and in fact extended the contract with Playtech.
Reading the above list, it can be seen why I might have thought Playtech was a business benefitting from a durable competitive advantage in the form of a rich dataset that enhances revenues for operators and may well benefit from “network effects” – as it increases revenues for operators it collects more useful player data making its offering even more powerful, and thus generating even greater revenues for its customers, creating a virtuous cycle. And given Playtech collects a revenue share from its operator customers, this created what I believed to be a stable business model that could endure, and get stronger, over time.
The insight
When operating in a world in which we are inundated with information, finding an answer you want is far easier than it has ever been. This can cause us (me!) to quickly latch on to evidence that supports the conclusions we hope to be true. As a result of this proliferation of information, I think now, more than ever, an ability to ask the right questions is far more valuable than the ability to find answers to your questions, and I expect the relative importance of these two to continue to widen going forwards.
So it follows that a key insight that caused me to change my mind on Playtech came as a result of spending time looking deeper to answer the right question. And that question was:
“If Playtech’s software really does increase online revenues for its licensees then what else would we see?”
Points 3, 4 and 5, above, appear to answer this question to some extent, but more specifically because Playtech’s revenue was a share of the net revenues its licensees were generating, I should have seen Playtech’s revenues from providing this “Netflix”-style offering growing at a rate that was faster than the market – if they were growing in line with or slower than the market then Playtech’s offering can’t be much better than average.
The challenge
If this were easy to figure out then of course I would have probably figured it out a lot sooner. The challenge with Playtech comes in trying to dissect what revenues are coming from which product verticals. Part of the reason it is difficult to do this (and close to impossible to do precisely) is because the segment presentation of revenues has been changed no less than three-times between 2014 and 2020 (2016, 2017 and 2019). This makes it difficult to answer even a simple question like “how much revenue has Playtech historically created for its licensees online”.
My goal was to figure out how much revenue Playtech was generating from providing online games to gambling operators supported by Playtech’s IMS platform, which provides the targeted bets that cause players to engage in more bets and thus increase revenues for operators.
The finding
What I found was that the revenues being generated from Playtech’s online operations, which were being benefitted by IMS were failing to keep up with the market growth overall. A more detailed look into my work in this area can be found in the attached Appendix.
For a technology that is supposed to be “leading” we would typically expect the performance to be better than average, not below average. This has led me to conclude that at a minimum, Playtech’s IMS platform and its ability to increase licensee revenues is not anywhere near as powerful as I first thought.
This was an analytical error on my part.
Some thoughts to ensure I’m not selling something I shouldn’t
There are many types of mistakes an investor can make and in this instance I am concerned with one error in particular:
- Selling something I shouldn’t
There is tendency for market participants to sell out of stocks after strong price increases similar to those we have seen in the past year (2020). Some explanations for this behaviour are fear of losing paper profits and a form of market “altitude sickness” where participants ask some variation of the question, “It’s already gone up this much, how much further can it go?” However, while Playtech’s price rise has been strong, I wouldn’t call it meteoric and therefore I don’t think these factors are at play here.
Nevertheless, in the same way I engage in “pre-mortems” when making a purchase decision, I also engage in this exercise when selling out of a stock. I’ll discuss this next.
The pre-mortem
A pre-mortem is said to be one of Daniel Kahneman’s (Nobel-prize winning behavioural psychologist) favourite tools for decision making.
A pre-mortem entails (i) projecting a current decision choice into the future and assuming it leads to a catastrophic failure, and then (ii) writing up one or more narratives that might lead to the disastrous outcome.
Not only does this exercise temper any overconfidence in ones choices, it also helps highlight any potential blind spots that might not have been given due attention in the decision making process. So let’s give it a go.
Suppose we sell out of Playtech stock at the current price of £4.51, but the price continues rising to near £8 over the next year. We missed out on this c.60% hypothetical move up, what set of business developments may have led to this price increase?
- Positive developments in the US
- Playtech has long talked about the power of its Sport-betting technology; pointing to anecdotal examples of its machines generating higher gross margins for operators than a competing product offered by Novomatic in Austria. Playtech may boost its revenues by selling large numbers of gaming machines to gambling operators and sports bars in the US market.
- “Marketplace” starts showing signs of becoming a powerful two-sided ecosystem for finding and distributing gambling games.
- The Marketplace offering is a 2-sided platform that has come about through Playtech’s heavy R&D spend, which is said to allow third-party games manufactures to sell their games into Playtech’s over 150 licensees and for licensees to access not only Playtech’s games but also those provided by third parties.
- This would manifest itself in the form of growing Casino or Services revenues, neither of which we have seen thus far.
I plan to monitor developments in these areas for Playtech going forwards.
Closing thought
A question that may come to mind is “given the growth potential from the opening up of the US sports betting market, why not just continue holding on to Playtech while the price is rising?” The fact that so many states are heavily indebted and are open to using gambling tax as a source of revenue to plug the holes may well provide a powerful tailwind for online gambling companies.
The answer to the question really lies in the fact that there will inevitably be some surprises up the road for Playtech and, as we have seen in Playtech’s recent history with the deterioration in its Asia revenues, not all these surprises will be positive. Durable competitive advantages protect a business’s operating cash flows from these negative surprises and in this case I appear to have numerical data that indicates that Playtech does not benefit from as strong a set of competitive advantages as I previously thought. It’s for this reason I am selling Playtech.
Appendix 1: The confusion
On page fourteen of Playtech’s FY ’19 annual report, a bar chart is displayed demonstrating the growth of the global online gambling market, this is shown below in Exhibit 1:
Exhibit 1: Playtech points out that the global online gambling market has been growing at 10% CAGR
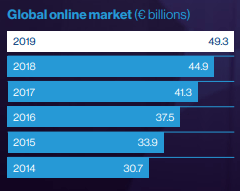
Source: Playtech FY ’19 Annual Report, p14
In order to get a feel for the power of Playtech’s IMS technology (“Netflix style” bet-recommender) we need to compare all the revenues Playtech is generating as a result of its “Netflix style” IMS bet-recommender technology relative to this market growth. This is given by taking all the “Gaming B2B revenue” less the revenue being generated in Asia (“Asia B2B revenue”) which is “content-only”. I refer to the residual as “Core B2B revenue”, as can be seen in Exhibit 2 below:
Exhibit 2: Core B2B excludes revenues that don’t benefit from “bet-recommender” technology

Source: Company filings
Immediately not great; it appears the Core B2B revenue has been growing slower than the market overall (9.7% vs. Global Online GGR 5yr CAGR of 9.9%).
Total Gaming B2B revenue is made up of revenues from supplying Casino games, Sports betting technology, Bingo games, Poker games and “Other” to gambling operators, and we know from past reports that 100% of Asian B2B revenue is from supplying only online Casino games (“content only”) to Asian operators – no powerful IMS back-end, bet-recommender technology.
The problem is, even excluding Asia, it’s not clear how much of this “Core B2B revenue” is from providing its technology “online” versus how much is from providing its services to “offline” customers. For example in the Sports vertical, in addition to providing some technology for online sports-betting, Playtech also provides sports betting machines to gambling shops and generates revenues on the sale of these machines i.e. offline.
This is an important distinction to make, because the Netflix-style “bet-recommender” technology which is supposed to increase revenues for gambling operators is purely online; it doesn’t increase the revenues made on betting machines in betting shops. And given an estimated 80% of UK betting shops use Playtech’s sports-betting Self-Service Betting Terminals (SSBTs), the “Sports” line item is probably highly skewed towards revenues from retail shops.
So I needed a “clean” measure of “online” revenues. The closest thing I could get to “pure online” revenues was to estimate Core B2B Online Revenue historically. Luckily for us, for the first time in Playtech’s history, management provided a figure for this in their March 2021 FY’20 presentation, as can be seen in Exhibit 3 below.
Exhibit 3: Playtech provides a Core B2B Online Revenue estimate for FY’19 and FY’20
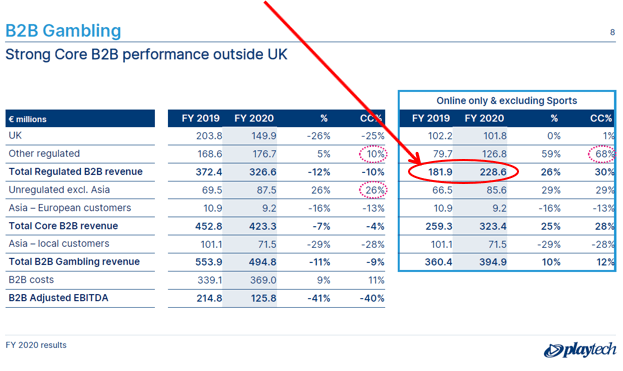
Source: Playtech FY20 Results presentation
The c. €182m figure for FY ’19 provides an output for me to work with, and thereby estimate this figure historically using segment level data provided in historic annual reports, by assuming:
- Virtually 100% of sports revenues come from retail sources (SSBT machines), and
- Playtech’s revenues from the Casino (ex. Asia), Poker, Bingo and 50% of “Other” are online and benefiting from Playtech’s IMS technology.
Having read nearly all of Playtech’s filings over the past five-years I believe both of these I are very likely to be accurate. Furthermore, I assume that c. €20m in Casino revenue from 2015 onwards is from “Land-based” sources, as a result of reporting changes the company made in that year, as shown in Exhibit 4 below.
Exhibit 4: Casino revenues from FY ’15 onwards includes revenues from Land-Based casinos
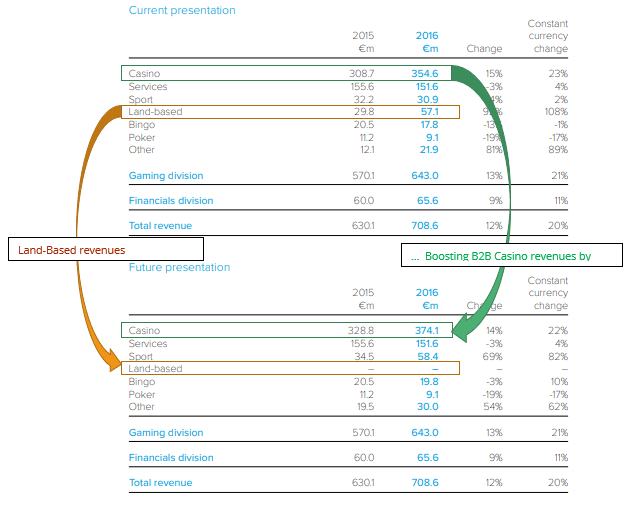
Source: FY’16 AR, p.39
Adjusting for these “Land-based” revenues and omitting Asian B2B revenues, my estimate of FY ’19 “Core B2B online” revenue of €178m (Exhibit 5) can be seen to be very close to Playtech’s own figure of €182m in Exhibit 3.
Exhibit 5: Estimating “Core B2B Online” revenue historically
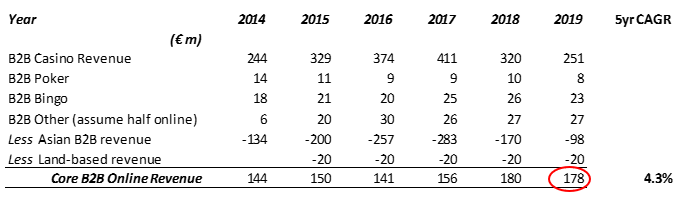
Source: The Equity Analyst
Immediately we notice that the 5-year compounded growth rate for the Core B2B Online Revenue has materially underperformed the market as a whole (4.3% CAGR vs. 9.9% CAGR, Exhibit 2), indicating Playtech has in fact been losing market share online.
The most obvious question then is,
“If Playtech’s online offering is a ‘leading’ technology and truly superior then why has it failed to keep up with the market growth?”
This evidence suggests Playtech’s online offering is not quite as powerful as management were making out and that I previously thought.
