Sunday 10th July, 2022
“Over the last 4 or 5 years, we’ve had this agenda on how we can unlock a lot of gross margin. We’re talking about a 1,000 basis point runway, and this was back when we were at 24% to 25% gross margin.”
– Niraj Shah, CEO of Wayfair, Q3 ‘21 earnings call
Wayfair’s free-cash flow yields are likely to expand from 1% in FY ‘21 to 8% by FY ’30 through expanding gross margins and reducing operating costs, as it continues to grow unit sales for suppliers and increases its base of repeat business.
1% FY ’21 FCF yield + 4ppts GPM + 3ppts Operating margin = 8% FY ’30 FCF yield
The combination of growing orders per supplier and repeat orders will support an expansion in gross profit margins from 28% in FY ’21 to 32% in FY ’30 and a reduction in advertising costs from 10% to 7% of sales over the same period. Capital expenditures, equaling 3% of sales, will likely be sustained at this historically stable level across tech (1%) and logistics (2%) to support continued improvement in its offering.
Its superior offering will facilitate share capture in its large TAM
Increases in unit sales, and the proportion of orders which are from repeat customers[1], will come from continued market share capture resulting from a superior customer offering.
Wayfair is likely to continue expanding its 2% share of the home goods market in the US, UK, Germany and Canada by adding customers and increasing wallet share. Of the c.210m households in these four countries, about 27m were Wayfair customers in FY ’21, and of the c.$2,400 the average household spends each year on their home, Wayfair collected $500 per customer in FY ’21. Both customer count and average spend have grown steadily for Wayfair since FY ’14, from 3m and $410, respectively.
Wayfair’s expanding selection within home categories draws in a broad spectrum of customer groups, each of which are offered a deep pool of relevant products at reasonable prices, with increasingly shorter average delivery times.
Gross margin growth from dynamic pricing and volume-based product cost reductions
The most likely drivers of Wayfair’s gross margin expansion will be its approach to dynamic pricing and the cost reductions it receives on products through volume-based rebates and shipping discounts. Wayfair’s ability to selectively pass on higher prices leans on its growing base of less price-sensitive, repeat customers. And on the cost side, vendor rebates reduce the product cost it owes suppliers following a sale, incentivizing Wayfair to increase unit sales for suppliers.
Within Wayfair, the global algorithmic pricing team sets prices. Unlike traditional retailers, which generally set prices at a fixed margin above their cost, Wayfair’s pricing team also incorporate details on who the customer is, what the buying behaviour of similar customers has been in the recent past and the price elasticity of customers on a specific product, in addition to several other variables, to maximise customer lifetime value.
“Another key area of differentiation is that pricing at Wayfair is based on consumer sensitivity to price, or price elasticity of demand, at the product level. For every product, Wayfair is able to calculate the unique optimal price, for a product, based on everything the company knows about how sensitive customers are going to be to changes in the price ofthat product… it is a dynamic pricing strategy. That means that prices change, dynamically, on a daily basis – sometimes several times a day – in response to consumer trends”
– Shaloo Savla, Fmr. Associate Director, Wayfair Pricing Strategy and Analytics, InPractise 9th Feb. ‘22
A key variable in determining how price inelastic a customer will be is their loyalty to the Wayfair brand. Wayfair have found through the continuous price-tests they perform that customers tend to be willing to pay more for faster delivery, prettier and more accurate product images and better customer service. It is for this reason that Wayfair is investing heavily into its proprietary logistics network, its technology and the supplier and customer experience. (Exhibit 1)
Exhibit 1: Wayfair invests to build customer loyalty
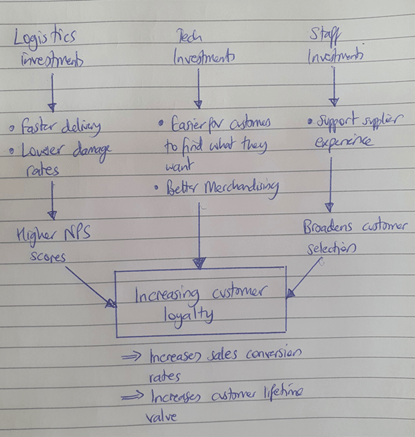
Source: The Equity Analyst
“To make customers sticky and more loyal to the Wayfair platform ….[that’s] really what is at the heart of Wayfair’s strategy. Those investments in supply chain, merchandising, selection, availability, service, all translate into customers being willing to pay more for a product they see on Wayfair’s platform.”
– Shaloo Savla, Fmr. Associate Director, Wayfair Pricing Strategy and Analytics, InPractise 9th Feb. ‘22
As can be seen in Exhibit 2 below, the investments Wayfair is making to engender loyalty are translating into a steady rise in orders coming from repeat customers – a metric that has shown uninterrupted growth from 55% in FY ’15 to 76% in FY ’21. This is significant given the number of active customers has grown from 5m to 27m between this time, roughly indicating Wayfair’s loyal customer base has increased 7-fold, from 2.9m to 20.5m[2].
Also in Exhibit 2, it can be seen that Wayfair has capitalized on this increasing loyalty to selectively increase prices, as reflected in the positive trend in average order values.
Exhibit 2: Wayfair selectively increases prices on a growing base of less price-sensitive, loyal customers
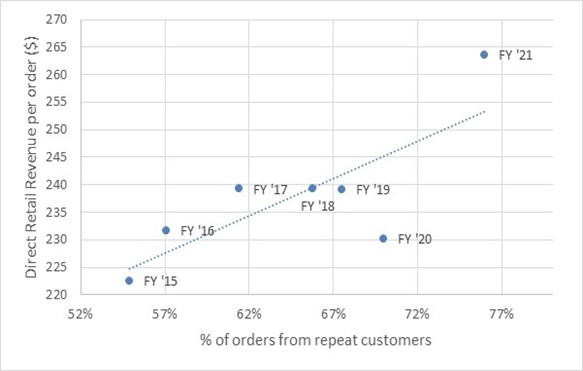
Source: Company filings
Cost of Goods Sold is made up of Product Costs (80%) and Shipping and Fulfilment costs (20%) (Exhibit 3). As such, falling Product Costs will be the largest driver of reducing COGS.
Exhibit 3: Product Costs make up the majority of COGS

Source: Company filings
Product Costs are made up of the amount Wayfair owes suppliers for goods as well as inbound shipping costs – the cost to get the goods from the suppliers’ warehouses to Wayfair’s fulfilment hubs. Both costs benefit from scale:
- Wayfair gets higher rebates from suppliers when it sells more units for them
- Wayfair gets lower freight rates from shippers when it pre-books more container slots with them
To quantify Wayfair’s current scale, in FY ’21 it sent 80,000 containers on ships from Asia to the US and Europe, equivalent to a Top 20 importer into the United States. This figure is set to double in 2022 and is up 100% from 40,000 containers in 2020.
“In 2021… CastleGate Forwarding offered a safety net for many of our suppliers and moved more than 80,000 20-foot equivalent containers during the year… This year, we expect to roughly double CastleGate Forwarding volume, which makes us a significant player in this industry.”
– Niraj Shah, CEO of Wayfair, Q4 ‘21 earnings call, 24th Feb. 2022
As we would expect based on these facts, as the number of orders per supplier has increased the Product Cost per order has decreased (Exhibit 4).
Exhibit 4: Growing orders per supplier, increases rebates, reducing product cost per order (total orders shown in brackets, millions)
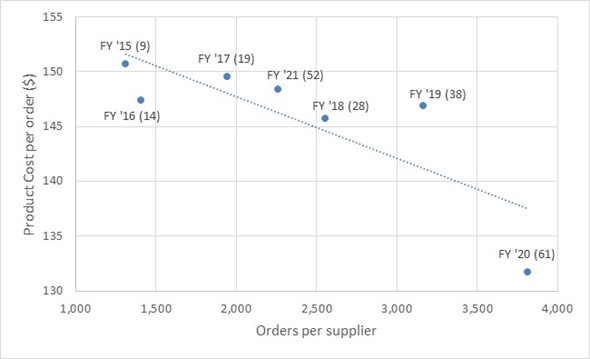
Source: Company filings
It is worth noting that in addition to processing less orders in FY ’21 (52m) relative to FY ’20 (61m), reducing orders per supplier (2,261 vs. 3,813) supply chain disruptions caused freight rates to spike in FY ’21, which in turn drove Wayfair’s higher Product Costs per order compared to FY ’18, FY ’19 and FY ‘20.
Though Product Costs will be the main driver reducing COGS, it is also worth noting that Wayfair’s ability to leverage its scale to increase drops per last-mile delivery route (an outbound delivery cost) – and add more pick-ups of returns to these routes– should also support a reduction in Shipping and Fulfilment costs as a percentage of sales.
High margin ad revenues from retail partners have historically hidden this growth in GPMs
The combined effect of Wayfair’s dynamic pricing and volume-based rebates can be seen by comparing Wayfair’s Direct Retail revenue to its Cost of Goods Sold, while excluding the historic high-margin revenue Wayfair used to earn from third party retail partner websites.
Ignoring this historic revenue source, which fell to zero in FY ’20, we can evaluate the gross margins on Direct Retail revenues, which have shown steady growth since FY ’15 as a result of the reasons discussed above. (Exhibit 5)
Exhibit 5: Wayfair’s pricing power is obscured by GAAP gross profit margin
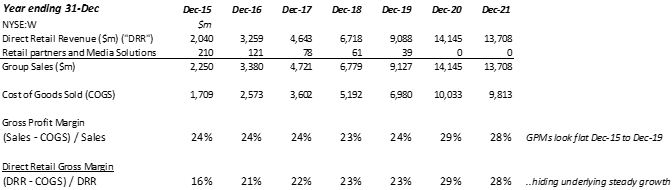
Source: Company filings
Appendix 1:Growing supplier count, repeat customer representation, with slower growth will drive gross margins to 32% by FY ‘30
Assuming:
- Repeat orders continue to grow as a percentage of the total at the current rate, they will represent 90% of all orders by FY ‘30
- Direct Retail Revenue grows in line with its historic relationship with percent of repeat orders
- A slowing growth in orders from 30% CAGR over the past 5 years to 18% CAGR over the next 9 years will grow annual order count from 52m in FY ’21 to 229m in FY ‘30
- A similar growth rate of 17% CAGR will increase supplier count from 23,000 in FY ’21 to 94,493 in FY ‘30
- Product Costs per order grow in line with their historic relationship with Orders per supplier
Modelling Wayfair’s GPM expansion to 32% in FY ‘30
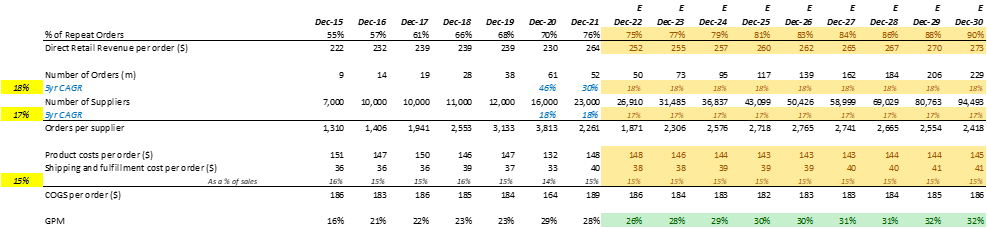
Source: Company filings, The Equity Analyst estimates
Appendix 2: Growth in the proportion of cheaper to solicit, repeat orders will compress ad-costs to 7% of sales
Repeat customers are more engaged, and ones that Wayfair has more up-to-date information on regarding their product interests. Therefore, through customer buy-in and more targeted marketing, repeat orders are cheaper on average for Wayfair to solicit than those from customers that have not shopped with Wayfair in the past two years.
Assuming:
- Sales grow at a 15% CAGR over the next 9 years, significantly slower than the 40% CAGR over the past 7 years.
- Repeat orders continue to grow as a percentage of the total at the current rate, they will represent 90% of all orders by FY ‘30
- 75% of repeat orders can be solicited through free mediums of advertising, such as email
- The sales dollars generated from paid-for advertising remains at the historic ratio of $4.5 in sales for $1 in ad-spend
Then the proportion of revenue generated from free advertising methods will grow as a proportion of the total, reducing advertising expenses as a proportion of sales to 7% by FY ‘30
Modelling advertising expenses falling to 7% of sales
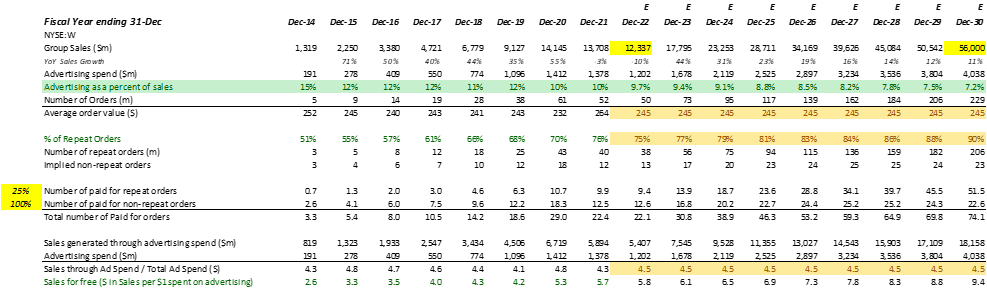
Source: The Equity Analyst estimates
[1] This assumes all active customers make the same number of orders each year. Repeat customers may well make more orders, but the point here is more about the growth and trajectory, not the exact numbers.
[2] Repeat customers are defined to be customers that shopped with Wayfair in the current and previous fiscal years. Repeat orders are those made by these customers.
