I recently wrote up a buy thesis on Activision Blizzard highlighting the reasons why I thought Microsoft would likely close its acquisition of it by September.
Microsoft (the acquirer) has said they would buy out all shares in Activision Blizzard (the target) using cash for $68.7bn, or $95 per share. I have bought shares in Activision Blizzard betting the deal will go through causing my shares to rise from the $75 price I paid to the $95 Microsoft will pay to take them off me.
Here are the key merger-arb related risks I learnt about, and evaluated, through my research process:
Why the deal might not go through
Regulatory risk: Is the regulator likely to try block the deal? This might be because they believe the deal will reduce competition in the industry.
Management risk: What is the risk the CEO of the acquiring company changes their mind on the terms they are offering the target company? Say they had promised the target company’s CEO that they would play a large role in the combined firm, is the acquiring CEO the type of spontaneously change his mind?
Union risk: Are any of the firms unionised, such that the unions could block the deal?
Due diligence risk: This is a big one. What’s the risk the acquirer finds something wrong in the target company in the due diligence process? If this happens, not only will the deal break, but shares in the target company will likely fall below the pre-announcement level.
Financing risk: Does the acquirer have the money to buy the target company? What’s the likelihood the financing they’re relying on does not come through?
Shareholder approval risk: Are a quorum of shareholders likely to vote in favour of the deal?
Why the deal might not go through at the initial value
In some instances, an acquirer may offer to buy out a target using their own shares. For example, Large_Co may offer Small_Co shareholders half a Large_Co share for every one of their Small_Co shares. If the price of Large_Co shares goes down, then the amount each Small_Co shareholder gets when the deal closes is lower.
This risk can be addressed by simultaneously shorting Large_Co shares while buying Small_Co shares to bet on the deal closing while locking in the current value. But this still requires the deal to close, otherwise prices will likely revert back to their pre-announcement level creating a loss for the merger-arb investor.
BUY Activision Blizzard (ATVI) shares for $75 in anticipation of Microsoft (MSFT) acquiring them for $95 in September 2023, after the likely approval by US, UK and EU competition committees.
If successful, it returns 27% in 8 months, representing a 36% annualised rate of return. If the deal doesn’t go through we may not even fall to the pre-announcement $65 (-13%) because of the cash MSFT would have to pay ATVI for break-up (currently worth $3 per share, rising to $4 in April).
By March 2023, September options on ATVI are likely to become tradable, potentially opening up the opportunity to trade an option strategy that can deliver a 10 to 1 return.
Currently the ATVI June-2023 80-90 Call Spread can be bought while selling ATVI June-2023 65 Puts for around $1. The same structure with a September maturity may be available for a similar price in late March or April.
If the merger completes at $95 we make a 10-1 return, if it doesn’t close and ATVI shares fall to $68 ($65 + $3) we lose our $1 premium. And if ATVI shares fall below $65, in the worst case, we get to own Activision Blizzard, a leading games maker, at $65 per share (30x trailing earnings).
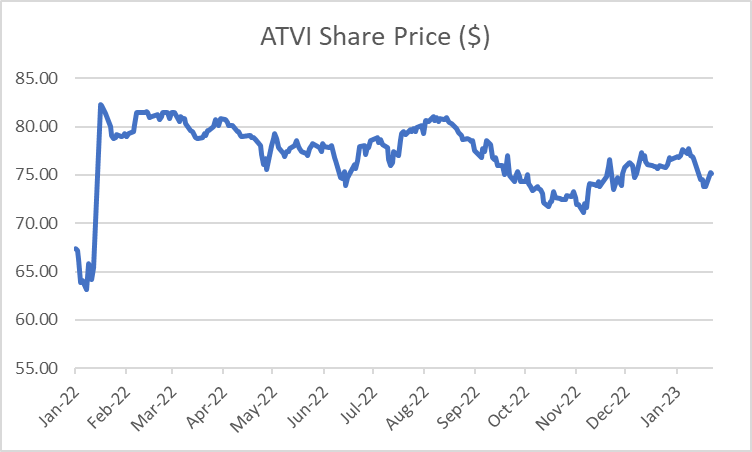
When Microsoft (MSFT) announced its intention to buy ATVI shares in January 2022 for $95 each, prices jumped from the previous day’s closing price of $65 to $82. Since then, ATVI shares have traded gradually down to the current $75 level (Exhibit 1)
Exhibit 1: Concerns about the deal being blocked have caused ATVI shares to trade down
Source: Capital IQ
Between the $65 start price to the $95 bid, the current $75 price implies the market is pricing a 1 in 3 chance the deal will close. This seems too low to me.
The deal is not anti-competitive
At the time when Microsoft announced the deal they had the goal of closing by June 2023, 5 months from now. However, on the 8th December 2022, the US Federal Trade Commission announced its decision to challenge the deal claiming it is anti-competitive.
FTC is probably wrong to think Call of Duty will be made exclusive to Xbox
The FTC said Activision Blizzard has brought its games to a variety of devices, irrespective of their manufacturers, but that might change if Microsoft were to complete the deal. Microsoft could adjust prices or worsen the experience on competing hardware such as Sony PlayStation consoles, or keep Activision Blizzard consoles from reaching consoles other than Microsoft Xbox systems, the agency said. A key concern of the FTC is that Microsoft will make the highly successful Call of Duty game exclusive to Xbox.
“The agency alleges that the deal would enable Microsoft to suppress competitors to its Xbox gaming consoles and its rapidly growing subscription and cloud-gaming business.”
It’s not in Microsoft’s economic interest to make Call of Duty exclusive
This statement appears to overlook MSFT’s economic incentives. In a note to investors, Jeb Boatman, Senior Vice President of Litigation, Regulatory, and Public Policy Law at Activision Blizzard highlighted why it is not in Microsoft’s interest to make Call of Duty exclusive to Xbox:
“Making Call of Duty exclusive to Xbox doesn’t make good business sense. Microsoft would lose billions of dollars in lost sales and would infuriate both PlayStation owners (who would lose Call of Duty) and Xbox owners (who would lose the ability to play with their friends who own PlayStations). The player backlash would be disastrous. It would destroy Microsoft’s trust with players and its brand, something Microsoft has spent decades building and protecting.”
-Jeb Boatman, Senior Vice President of Litigation, Regulatory, and Public Policy Law at Activision Blizzard, 8th Dec 2022
While the reputational risk argument appears solid, MSFT’s economic incentive argument is what the FTC is targetting. In its announcement the FTC stated:
“Microsoft decided to make several of Bethesda’s titles including Starfield and Redfall Microsoft exclusives despite assurances it had given to European antitrust authorities that it had no incentive to withhold games from rival consoles.”
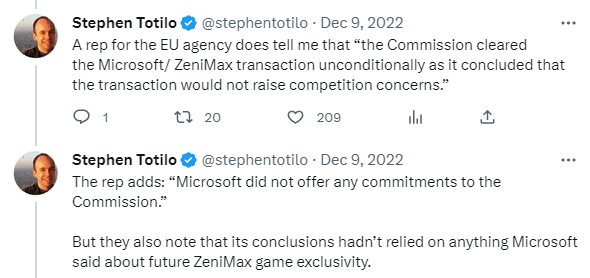
But the FTC is wrong, and EU competition officials are telling them as much. In a conversation with Steven Totilo, a video games reporter for Axios, an official from the EU competition commission highlighted that Microsoft made no promises about future exclusivity (Exhibit 2)
Exhibit 2: EU officials say MSFT didn’t make any commitments to them
This weakens the FTC argument that MSFT will renege on a promise and make Call of Duty exclusive to Xbox at a later stage.
Microsoft has already signed non-exclusivity agreements with key competitors
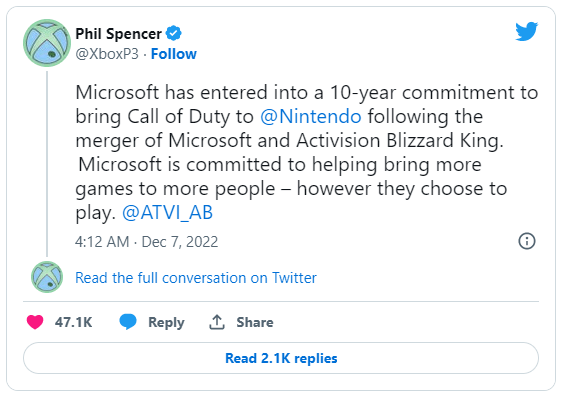
On December 7th 2022, Microsoft announced the signing of 10 year contract with Nintendo (Exhibit 3) came shortly after Microsoft President Brad Smith said company has offered Sony a 10-year contract to make each new release of Call of Duty available on Sony’s PlayStation console at the same time as the Xbox.
Exhibit 3: Microsoft has locked in non-exclusivity for a decade
Importantly, as a part of the Sony deal ATVI games will now be available on PlayStation Plus, their subscription service, which they weren’t previously. This indicates the MSFT-ATVI deal will increase consumer choice.
Microsoft’s gaming chief Phil Spencer said that the firm has also “committed” to offer Call of Duty on Steam, an online game distribution platform, simultaneously to on its own streaming platform Xbox Game Pass after the close of the deal.
Microsoft has stated it is eyeing non-console growth from this acquisition
In an interview with the WSJ in November 2022, Microsoft’s gaming chief Phil Spencer highlighted that the opportunity MSFT sees in this deal is really around mobile, not about bringing player’s onto its Xbox platform:
“This opportunity is really around mobile for us…when you think about 3bn people playing video games, there’s only about 200m households that play on console. The vast majority if people play on the device that’s already in their pocket. What really interested us in Activision was the great work they had done in building out such large mobile followings.”
-Phil Spencer, Microsoft Gaming CEO, 4th Nov 2022
Subscription services for the streaming of games (such as Microsoft’s Xbox Game Pass) continue to make inroads. There may well come a point where consumers can play “Triple A games” – those with higher development and marketing budgets than other tiers of games – over the cloud without the need for consoles or gaming computers.
Owning ATVI if deal breaks is not bad
Backstop: The amount MSFT has to pay ATVI if the FTC blocks the deal just went up from $2bn to $2.5bn – the equivalent of about $3 per ATVI share ($2.5bn/783m shares outstanding)
As of 18th January, we have just entered the second phase of the acquisition timeline in which the fee for Microsoft to back out from the deal has increased from $2 to $2.5bn. From April 18th this steps up again to $3bn (Exhibit 4)
Not only does this add pressure on MSFT to close the deal, it also increases the buffer of protection buyer’s of ATVI shares get. With 783m shares outstanding this $2.5bn of cash MSFT would pay adds $3.19 per share in value to ATVI, rising to $3.83 from April 18th.
Exhibit 4: The termination cost Microsoft would have to pay ATVI just increased by $500m
Source: ATVI 8-K, 19th January 2022
A market leader: ATVI is home to billion dollar game franchises including Call of Duty, World of Warcraft and Candy Crush -one of the most popular mobile games in the world, with ~250m monthly active players. The group has 400m MAPs across 190 countries.
Growing market: Gaming is the largest and fastest growing category in entertainment. Today, 3bn people play games, which MSFT expects to grow to 4.5bn by 2030 (5% CAGR).
Net cash on balance sheet
Appendix 1: Timeline
18 Jan 2022: Microsoft announces plan to acquire ATVI for $68.7bn cash ($95 / share) 30 Jun 2022: CWU writes to FTC in support of merger (CWU announcement) 6 Jul 2022: UK CMA opens investigation into merger (CMA Case page) 8 Dec 2022: US FTC announces it seeks to block the merger (FTC Case page)
26 Apr 2023: UK CMA Statutory deadline for investigation (CMA Case page) 2 Aug 2023: US FTC Commencement of hearing 10am E.T. (FTC Scheduling Order)
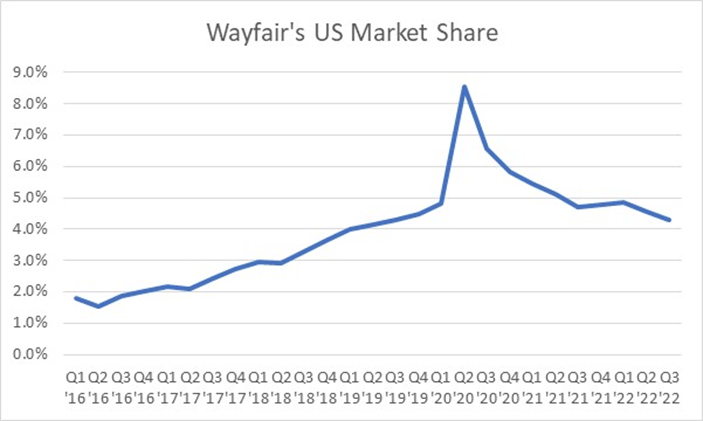
Since hitting its peak valuation of $33bn, or $330 per share in the Summer of 2021, Wayfair has:
Posted double-digit declines in revenues, YoY. This caused it to give back the market share gains it made during the COVID lockdowns
Been burning through ~$300m in cash in each of the four quarters to September 2022
It is unsurprising shares fell ~90% to $33 over the period.
My analysis of St. Louis Fed Economic data in conjunction with relevant quarterly segment sales data of the main US home goods retailers appears to suggest the key driver of company sales in the years during and after COVID have been their exposure to the high-street and online sales channels.
Online only players such as Wayfair and Overstock saw market share gains in 2020, which have subsequently been given back. Whereas the more balanced businesses of Williams Sonoma and RH have maintained market share over time. Bed, Bath and Beyond, which had a minimal online presence pre-COVID got battered and looks like it might not survive.
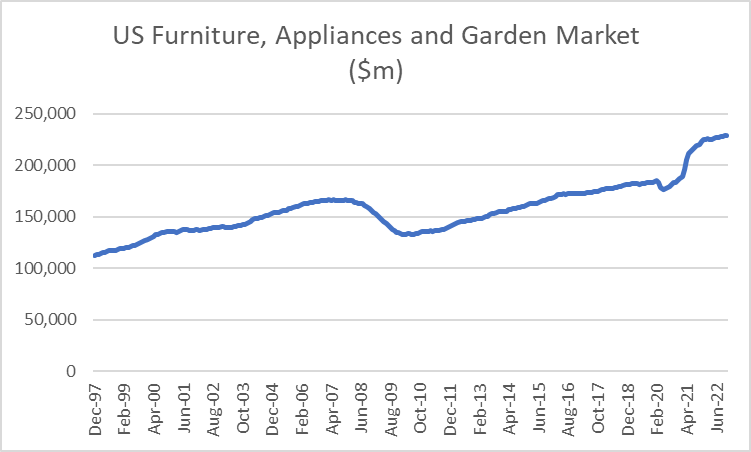
The US Furniture, Appliances and Garden Equipment market has shown slow but steady growth in recent years, with strong pick up in demand in 2021 (Exhibit 0)
Exhibit 0: US Home Goods market has shown some growth in 2021
Source: Federal Reserve Economic Data
By contrast, Wayfair’s rapid growth pre-COVID and lockdowns enabled its market share to rise to 8.5%, before coming back down to levels seen in 2019, as lockdowns eased. (Exhibit 1)
Exhibit 1: Wayfair has given back the market share gains it made during COVID lockdowns
Source: Company filings, Federal Reserve Economic Data
What’s important to remember is that it is likely this share loss dynamic is a function of Wayfair being an online only home goods retailer. Meaning it is possible this market share gain and subsequent loss are largely a function of consumers shifting their spending almost exclusively online, and then back to the historic online-high street mix of the past.
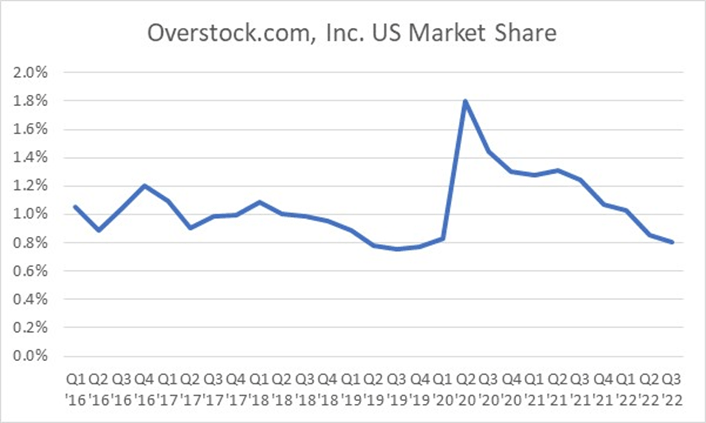
If this hypothesis were true, we would expect to see a similar market share dynamic in other online-only home-goods retailers in the US. The only other online-only competitor I have been able to pull US sales data on is Overstock.com, whose market share appears to follow a similar pattern, albeit at a lower market share level. (Exhibit 2)
Exhibit 2: OverStock.com, an online-only home goods retailer, has also lost market share post COVID
Source: Company filings, Federal Reserve Economic Data
The flip side of this dynamic is to look at home-goods retailers that had a minimal online presence before COVID and had to play catch up. Here the poster child is Bed, Bath and Beyond. As can be seen in Exhibit 3 below, the business looks to be on track for bankruptcy. (Exhibit 3)
Exhibit 3: Bed Bath and Beyond had no pre-COVID online presence and is struggling to catch up
Source: Company filings, Federal Reserve Economic Data
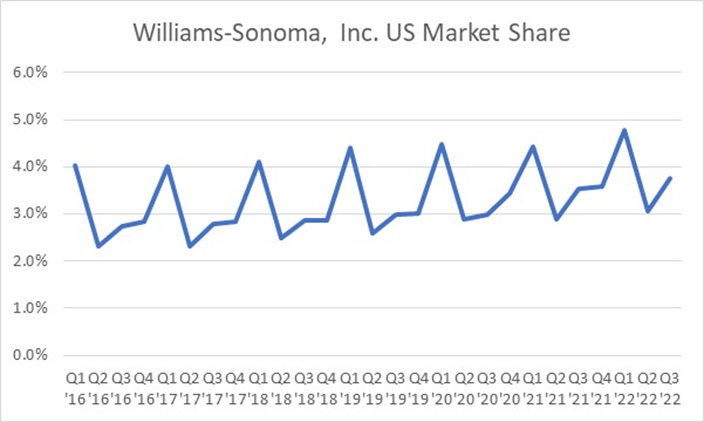
In between these two extremes we have companies like Williams Sonoma and Restoration Hardware (RH) who generated revenues online as well as on the high-street pre-COVID. Here we see they both managed to retain their market share through the period, with the mix-shift likely shifting to online during lockdowns. (Exhibits 4 and 5)
Exhibit 4: Williams Sonoma has managed to maintain market share over time likely as a result of having an online presence in addition to high-street shops
Source: Company filings, Federal Reserve Economic Data
Exhibit 5: …similarly with RH
Source: Company filings, Federal Reserve Economic Data
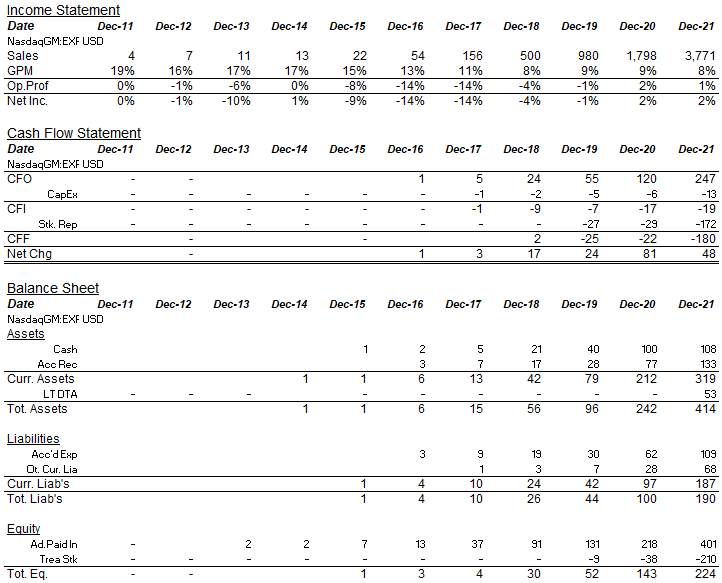
I recently read a write-up on eXp World Holding (NasdaqGM:EXPI), an online real-estate brokerage firm in the US on Value Investors’ Club, here.
The “pyramid scheme” nature of acquiring and retaining real-estate agents, combined with the revenue-share nature of paying them, may well provide a durable moat for this business, enabling a consolidation of US housing transactions. With 50k agents currently (6% of agents in the US) and ambitions to reach 250k, there may well be room for growth ahead.
With TTM revenue growth slowing (from 97% in Sep-21 to 12% in Sep-22), the 50x TTM FCF multiple looks ripe for de-rating.
eXp gives all agents their own websites, CRM and health insurance (through Clear Water, not many other brokerages offer this). This should help in retaining the agents EXPI has acquired in the past.
Agents get a share of revenue generated by agents they bring to the platform into perpetuity, funded by EXPI.
The attractive economics of the model for agents should help EXPI organically bring agents onto their platform, reducing their reliability on agents bringing in sponsored agents (with lower margins for EXPI) (Exhibit 1)
Exhibit 1: EXPI offers agents 80%+ of the brokerage revenue made on closing a sale
Source: Company presentation, Q2 ’22
Things that concern me about EXPI
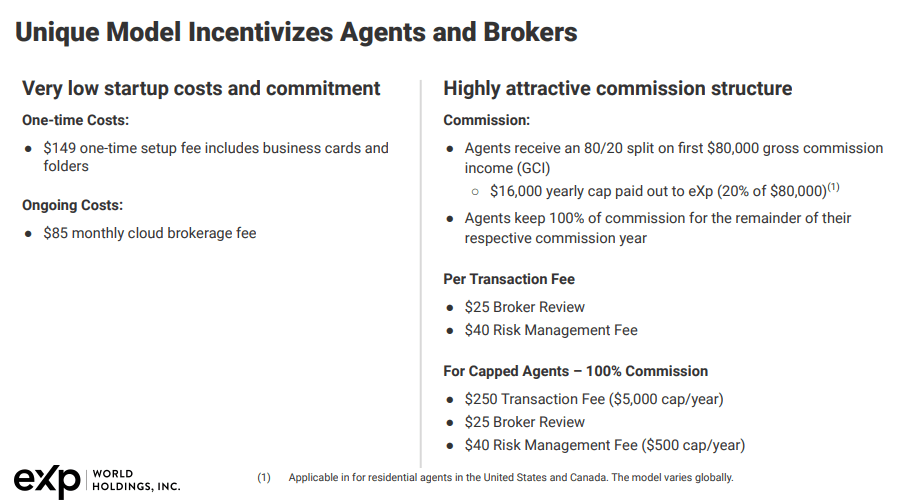
Valuation: At $2bn, the company is currently valued at 52x earnings from Sep-21 to Sep-22 (Q4’22 numbers not yet released), and 60x free-cash-flow (Net Income plus depreciation and amortisation, less capex) over the same period. Given the year-on-year sales growth over that period has declined from 97% to 12%, the risk of a de-rating seem high. (Exhibit 2). With US house prices now declining in several cities, and mortgage rates high relative to disposable incomes, the risk is exacerbated.
Exhibit 2: The rapid decline in growth makes a stock de-rating likely
Source: Company filings
2. EXPI’s share of commissions is limited to $16,000. That means if house prices grow (as they have historically at 5.5% CAGR) then EXPI will likely see its gross margins contract into single digits.
Might be good-Might be bad
As the business grows (more agents on the platform) the benefit to new joiners does not improve in the way of a social network. In fact, because of the “no geographical limits” imposed on the cities agents can operate in, it might well be the case that agents and all their sponsors split off into separate “pyramid” teams that compete with one another. Its unclear to me if this type of potential internal competition would be beneficial to EXPI overall or that it might damage the image of the broker to home buyers and sellers.
Things I don’t know the answer to yet
EXPI closed around 500k homes in 2022. This compares to total homes sold in the US each year of about 5-6m. They currently operate in 20 countries and plan to be in 100 countries by 2031. There is a risk this ambition fuels reckless agent-acquisition costs as they look to break into new markets.
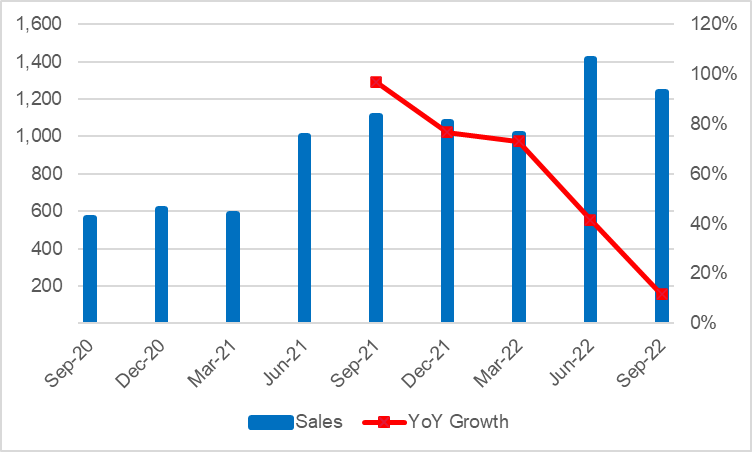
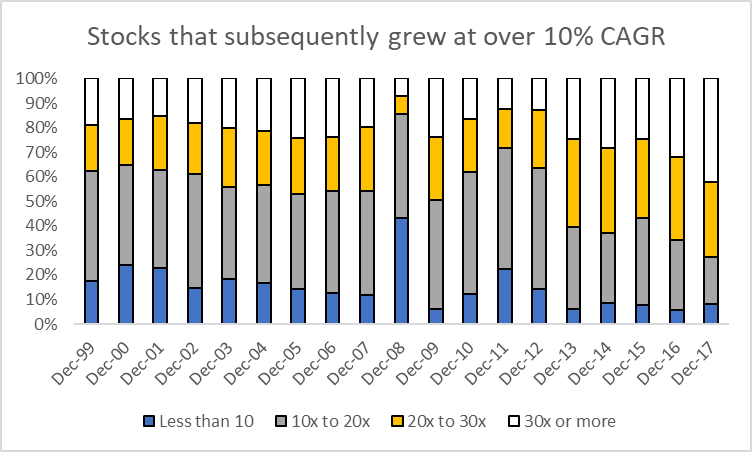
Over the past two decades, stocks with a price-to-earnings ratio of less than 30x have represented about 80% of all stocks with a market cap over $1bn. It is for this reason that about 80% of stocks that generate five-year compounded returns of over 10% have been stocks that started out with a P/E ratio less than 30x.
That is, if we are looking for stocks that will generate returns of 10% or more per year high P/E stocks are just as good a hunting ground as low P/E stocks. It is just that there are more low P/E stocks in the initial population so they feature more frequently in the output.
In Exhibit 1 below we can see the distribution of US stocks by P/E multiple between 1999 and 2017. The tiny proportion of stocks with a P/E ratio 30x and over are shown in white.
Exhibit 1: Stocks with a P/E ratio less than 30x have consistently represented ~80% of the total
Source: The Equity Analyst
The value in evaluating these P/E ratios through to 2017 is that we can now evaluate if these low-P/E stocks were able to generate higher market capitalisation gains over the subsequent five years – that is to say, if these low-P/E stocks were “cheaper” or better investments.
Looking at the subset of stocks that generated compounded annual gains of over 10% over five years, I looked to see if the stocks that started out with a low-P/E ratio represented a higher proportion of this group relative to their share in the overall population.
Interestingly, as can be seen in Exhibit 2 below, while the majority of the high returning stocks started out with a P/E ratio of less than 30x, their share in this group is smaller than that in the starting population (~80%, Exhibit 1) .
Exhibit 2:Low P/E stocks don’t generate their fair share of high returns
Source: The Equity Analyst
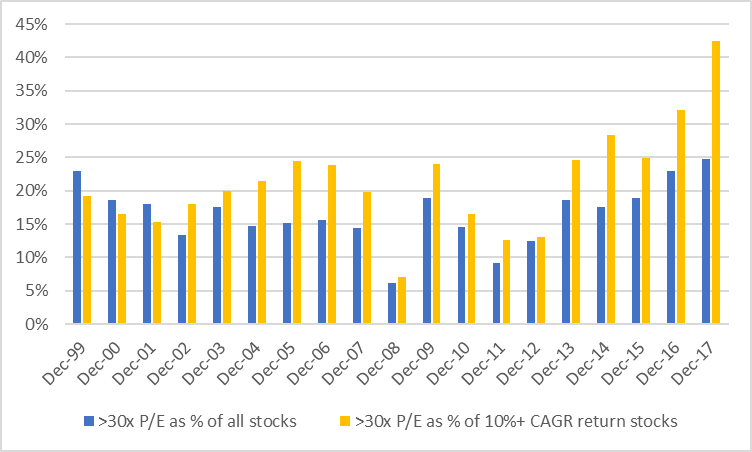
But more interesting is the fact that, since 2002, stocks with a P/E above 30x have consistently represented a disproportionately large share of high return stocks.
That is to say, for example, that while only 25% of stocks in Dec-17 had a P/E ratio of 30x or more (Exhibit 1), 42% of the stocks from 2017 that grew at over 10% CAGR subsequently started with a P/E of 30x and over (Exhibit 2).
In general, this can be seen by comparing the size of the white bars in Exhibit 2 to those in Exhibit 1 – the white bars in Exhibit 2 are almost always bigger. I have put these side-by-side in Exhibit 3, below.
Exhibit 3: Stocks with a P/E > 30x represent a disproportionately high share of 10%+ CAGR returns
Source: The Equity Analyst
One way to read the graph above is to think of the blue bars as representing the number of stocks that have a P/E ratio of above 30x. So in 2008, for example, during the Global Financial Crisis, only about 6% of stocks were trading with a P/E ratio of above 30x. Therefore, it makes sense that of all the stocks that went on to generate 10%+ CAGR returns from 2008 onwards, the ones that started with a 30x multiple made up a small share – about 7% (orange bar in 2008).
To recap, we’ve established that:
Stocks with a P/E multiple of 30x or more usually represent about 20% of all stocks (Exhibit 1)
Of all the stocks that will go on to generate returns of over 10% per year for the next 5 years, those starting with a P/E ratio of 30x will represent a greater share of that sample than they did in the starting population of stocks (Exhibit 3).
As of November 2022, Berkshire Hathaway owned 895m shares in Apple (APPL). This position was valued at $124bn, roughly 40% of the $296bn in marketable securities managed by Warren Buffett and his portfolio managers: Todd Combs and Ted Weschler.
Why does one of the greatest investors of all time have so much of his capital allocated to the stock right now?
According to Counterpoint Research, Apple shipped just 14% of all smartphones globally in the first nine months of 2022, but it accounted for 43% of all revenues and 82% of all profits – its highest profit share since 2015.
COVID in China may continue to disrupt supply of iPhones
Recent months have been chaotic for Apple, which in November said it was experiencing “significant” disruptions in the assembly of high-end iPhones, following an outbreak of Covid at a megafactory in Zhengzhou, which is run by Foxconn, its biggest assembler.
Concerns around the production of iPhones in China linger. As the country removes its zero-COVID restrictions we are being reminded why they had them in the first place. While 90% of Chinese nationals are said to have been vaccinated it masks the fact that the country’s homegrown vaccines are less effective than the mRNA ones used widely elsewhere. This could lead to a spike in COVID-related deaths in China this year.
Key area’s of dominance
App ecosystem – Apple iPhone users face great hurdles if they consider moving over to use a Samsung or Google phone: they risk losing all their photos stored in Apple’s cloud and usually have to learn new software functionality (what button do I press to go “back”?).
Purchasing power – Apple recently shifted suppliers for the manufacture of the iPhone Pro, from Taiwanese Foxconn to China’s Luxshare Precision. Apple’s large orders can make or break a supplier and therefore these suppliers usually have to bend to meet Apple’s demands.
In November 2022, the 32nd Annual Graham and Dodd Breakfast featured Todd Combs, one of the two portfolio managers allocating capital for Warren Buffett.
Source: Instagram @heilbrunncenter
In it, Combs explained how one question is constantly asked, usually daily, and that is:
“Is the moat wider or narrower on any of their businesses?”
Furthermore, he highlighted that he goes to Buffett’s house on many Saturdays to talk, and here’s a litmus test they frequently use.
Warren asks :
“How many names in the S&P are going to be 15x earnings in the next 12 months?
How many are going to earn more in five years (using a 90% confidence interval), and
How many will compound at 7% (using a 50% confidence interval)?”
In this exercise, you are solving for cyclicality, compounding, and initial price. This rubric was used to find Apple, since at the time the same 3-5 names kept coming up.
Todd Combs, Berkshire Hathaway portfolio manager, November 2022
In order to better understand why Buffett might be asking these questions, we might ask:
What percentage of companies in the S&P 500 have historically traded at or above a 15-times earnings multiple?
How many companies in the S&P 500 earn more in 5 years than they are currently? And how much does this number vary by year?
Background ARLP is the second-largest coal producer in the eastern United States. It makes and sells “steam coal” – coal burned to produce steam for the production of electricity – for utilities and industrial companies.
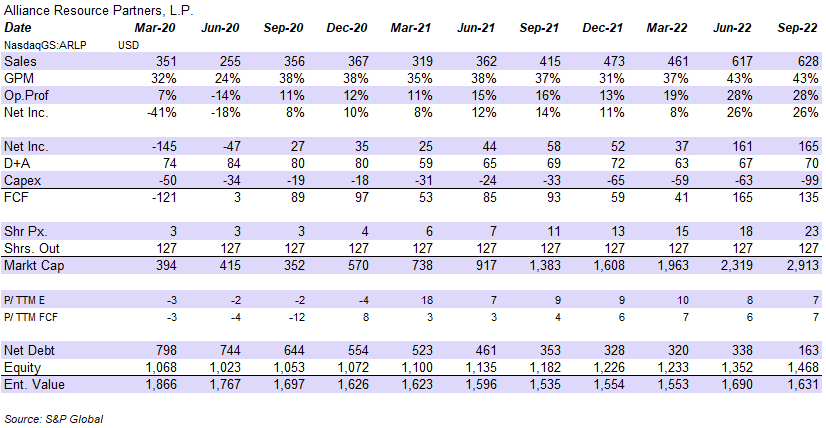
Looking at historic financials (Exhibit 1), we can see the business has seen a near doubling in quarterly sales from $319m in the first quarter of 2021 to $628m in the third quarter of 2022.
Exhibit 1: Historic Quarterly Financials
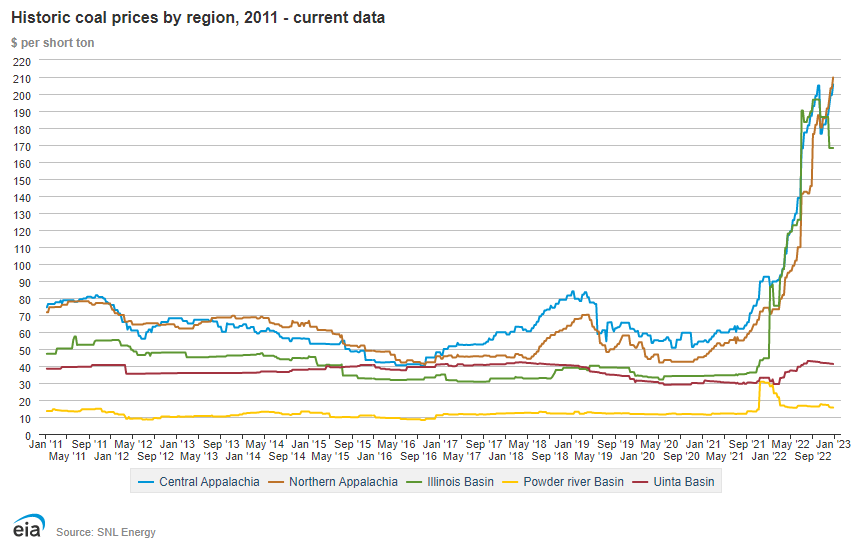
With its two key operating segments being: Illinois Basin and Appalachia, it has likely benefited from the near tripling of coal prices in these regions from c.$70 per short ton in January 2021 to c.$210 per short ton at the end of 2022, near all time highs. (Exhibit 2)
Exhibit 2: ARLP has benefitted from the record rise in coal prices
According to an IEA press release in July 2022, the rise in coal prices has been driven by increased demand from India and users switching from using natural gas to coal:
“Global coal demand is being propped up this year by rising natural gas prices, which have intensified gas-to-coal switching in many countries, as well as economic growth in India. Those factors are being partly offset by slowing economic growth in China and by the inability of some major coal producers to ramp up production.”
IEA, “Global coal demand is set to return to its all-time high in 2022”, 28 July 2022
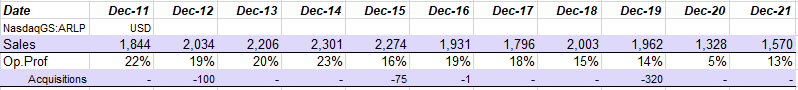
What is striking is the company’s poor acquisition record. Despite having spent c.$500m on acquisitions between 2011 and 2021, company sales are down $300m as are operating margins, from 22% in 2011 to 13% in 2021 (Exhibit 3).
Exhibit 3: Despite burning $500m on acquisitions, ARLP has seen sales and margins decline
Over the same 10 year window, coal prices are largely unchanged (Exhibit 2), potentially highlighting the operating headwinds facing coal producers generally and specifically, a poor capital allocation record on the part of ARLP.
There are concerns that a policy mistake could lead to a a sell off in the currently illiquid, US Treasury market, similar to that seen in British Gilts in September 2022. Were this to happen, it could have devastating consequences for a long list of funding markets that base their rates on USTs.
The inflationary backdrop also limits what the Fed and US Treasury might be able to do to support the market without fuelling inflation further.
The backdrop: Inflationary pressures limit fiscal support; falling oil and end of China’s zero-COVID should help
No low interest rates anymore
These were caused by:
Fed cutting base rates and
US treasury buying US government bonds
Now have double digit inflation
These started because of:
People wanting to spend on things (during lockdowns) and experiences (after)
People leaving the labour market so:
less staff at ports to process goods arriving, reducing the supply of goods, thus increasing the price of goods
employers offering higher pay to staff – wages are rising faster than the Fed’s 2% target growth rate, as can be seen in the St Louis Fed data.
Energy supply reduced as a result of the war in Ukraine.
But inflation looks likely to decline from here because…
Key Risk: UST market is now bigger and more illiquid than ever
Liquidity is already low in the US Treasuries market- traders are complaining it is hard to execute orders without moving the price (Exhibit 1).
The main cause of this reduced liquidity were the regulations enacted following the global financial crisis which required banks to set aside minimum levels of capital (including US Treasuries) against assets. This discouraged banks from acting as intermediaries in the US government debt market.
Exhibit 1: Liquidity in USTs dried up following enactment of post-GFC bank regulations
If trading were to cease for a prolonged period it could prove disastrous.
Potential consequences have been well laid out in a recent note by Bank Of America:
“If the Treasuries market fails to trade for a period of time, various credit channels, including corporate, household, and government borrowing and securities and loans would cease. This could lead to events such as US government debt default…inability to convert Treasuries to cash or meet corporate, household, or government obligations globally, the inability to produce SOFR, which forms the backbone of the $125 trillion USD derivatives market, the inability to issue, trade, or hedge debt of corporates, municipalities, insurance companies, banks.”
Bank of America note, 7 September 2022
In 2001 US Treasury debt outstanding was $3T (30% of GDP). In 2022 it is $23T (100% of GDP). The plumbing of the intermediation of the market — the amount of capital allocated to market-making — has not expanded at the same pace. This has made the UST market very illiquid at points like Mar-20 or Sep-19.
Potential trade: How much do 3 year Put Options on the 10-year US Treasury cost?
-In the event of a war, bond issuance would likely increase, causing prices to fall further.
-In the event of a policy error, causing a rapid sell of in USTs – similar to the LDI debacle in the UK in September 2022 – US Treasury bonds could fall c.10% in a day.
28 Dec ’22, “Taiwan to bolster military readiness“ From 2024, compulsory military service for men will be extended from the current four months to a year and conscripts’ pay will be quadrupled to bring it in line with the minimum wage. This follows two days after Beijing staged the largest air manoeuvres around Taiwan in four months.