The premiums paid for options are assets accounted for in the balance sheet under “Lot Deposits”, as of September 30, 2022 these were valued at $291m.
Having to walk away from all option premia would be a bad outcome. The impact on the balance sheet would depend on:
how quickly DFH is forced to make these writedowns, and
how many inventory units it sells during the same period
DFH’s current lot deposits of $291m represent about 40% of book at $715m and just over half of tangible book value of $545m (As of Sep 30, 2022). One way I thought to model a “worst case” scenario was to look at NVR during the Global Financial Crisis. (Exhibit 1)
Exhibit 1: NVR wrote down its Contract Land Deposits by 93% during the GFC
Source: Company filings
At the end of FY ‘06, NVR held $402m in contract land deposits [1] vs book value of $1,150m (c.35%). Over the subsequent two years, these deposits were written down by 93%: to $188m in FY ’07, then to $29m in FY ’08. These flow through Cost of Sales, compressing Gross Profit Margins.
Over the same period annual unit sales [6] fell from 15,100 in FY’06 to 13,500 in FY’07 and 10,700 in FY ’08 (-30% total) and ASPs fell from $400k to $340k (-15%).
To put these unit sales into context, at the end of FY ’06, their inventory [2] of homes being built or completed was $730m or about ($730m / [$400k ASP * 80% CoS]=) 2,300 homes. Total inventory at FY ’08 was $400m or about (400m/(340k*87%))=1,360 homes. i.e. inventory shrunk faster than sales, generating cash and buffering the balance sheet.
As a leading indicator NVR probably also noted the falls in new orders [8], which slowed from 13,000 in 2006 to 8,800 in 2008 (-66%).
By adjusting building starts (Inventory) with new orders, inventory turn rates were maintained at c.60days / 2months.
It would be a fair assumption to make for DFH, or any other builder, to adjust their building starts with changes in new orders and thus sustain inventory turn rates. (Exhibit 2)
Exhibit 2: DFH would likely reduce building starts (Inventory) with sales, conserving cash
Source: The Equity Analystestimates
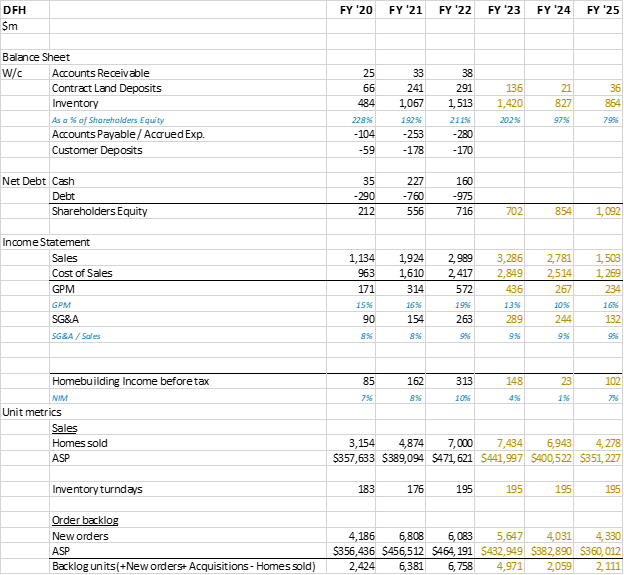
DFH’s current inventory is $1,500m (September 30, 2022), with ASPs of $470k, Cost at 80% of this, it implies DFH has ($1,500m / ($470k ASP * 81% CoS)) = 4,000 homes in inventory. With inventory turning every 195 days this implies DFH might sell roughly (4,000 * (365/195)=) 7,500 homes in FY ’23.
What is worth comparing here is the percentage of Contract Land Deposits to Inventory x Inventory Turns. This provides an indication of :
If all of contract land deposits were written down in 1 year, but the firm maintained their inventory turn rate, by what percentage would Cost of Sales be increased?
For NVR in FY ’06 the percentage was 8.5% and for DFH in FY’22 its about 10%. With CoS being roughly 80% of sales in both cases, this would roughly imply a 7ppt drop in GPM for NVR in FY ’07 and 8ppt for DFH in FY ’23, in a 2008 style housing market.
Of course there wouldn’t be a 100% writedown of options in 1 year, but there would be some dis-economies of scale so net-net it might be a fair assumption.
Inventory = orders received from customers (who have paid deposits and have initial mortgage approval) versus optioned land. In many cases, customers have played an active role in the custom design of their home while it is being built – so in these cases customers may be walking away from their “ideal home” in addition to their deposit.
“Over the last 4 or 5 years, we’ve had this agenda on how we can unlock a lot of gross margin. We’re talking about a 1,000 basis point runway, and this was back when we were at 24% to 25% gross margin.”
– Niraj Shah, CEO of Wayfair, Q3 ‘21 earnings call
Wayfair’s free-cash flow yields are likely to expand from 1% in FY ‘21 to 8% by FY ’30 through expanding gross margins and reducing operating costs, as it continues to grow unit sales for suppliers and increases its base of repeat business.
The combination of growing orders per supplier and repeat orders will support an expansion in gross profit margins from 28% in FY ’21 to 32% in FY ’30 and a reduction in advertising costs from 10% to 7% of sales over the same period. Capital expenditures, equaling 3% of sales, will likely be sustained at this historically stable level across tech (1%) and logistics (2%) to support continued improvement in its offering.
Its superior offering will facilitate share capture in its large TAM
Increases in unit sales, and the proportion of orders which are from repeat customers[1], will come from continued market share capture resulting from a superior customer offering.
Wayfair is likely to continue expanding its 2% share of the home goods market in the US, UK, Germany and Canada by adding customers and increasing wallet share. Of the c.210m households in these four countries, about 27m were Wayfair customers in FY ’21, and of the c.$2,400 the average household spends each year on their home, Wayfair collected $500 per customer in FY ’21. Both customer count and average spend have grown steadily for Wayfair since FY ’14, from 3m and $410, respectively.
Wayfair’s expanding selection within home categories draws in a broad spectrum of customer groups, each of which are offered a deep pool of relevant products at reasonable prices, with increasingly shorter average delivery times.
Gross margin growth from dynamic pricing and volume-based product cost reductions
The most likely drivers of Wayfair’s gross margin expansion will be its approach to dynamic pricing and the cost reductions it receives on products through volume-based rebates and shipping discounts. Wayfair’s ability to selectively pass on higher prices leans on its growing base of less price-sensitive, repeat customers. And on the cost side, vendor rebates reduce the product cost it owes suppliers following a sale, incentivizing Wayfair to increase unit sales for suppliers.
Within Wayfair, the global algorithmic pricing team sets prices. Unlike traditional retailers, which generally set prices at a fixed margin above their cost, Wayfair’s pricing team also incorporate details on who the customer is, what the buying behaviour of similar customers has been in the recent past and the price elasticity of customers on a specific product, in addition to several other variables, to maximise customer lifetime value.
“Another key area of differentiation is that pricing at Wayfair is based on consumer sensitivity to price, or price elasticity of demand, at the product level. For every product, Wayfair is able to calculate the unique optimal price, for a product, based on everything the company knows about how sensitive customers are going to be to changes in the price ofthat product… it is a dynamic pricing strategy. That means that prices change, dynamically, on a daily basis – sometimes several times a day – in response to consumer trends”
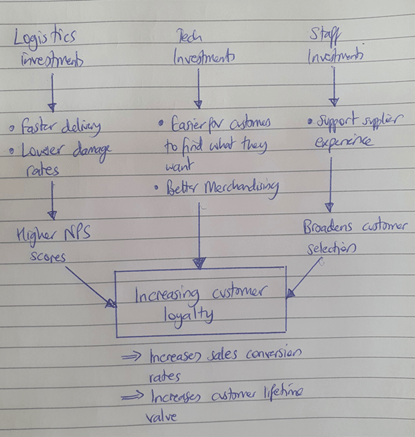
A key variable in determining how price inelastic a customer will be is their loyalty to the Wayfair brand. Wayfair have found through the continuous price-tests they perform that customers tend to be willing to pay more for faster delivery, prettier and more accurate product images and better customer service. It is for this reason that Wayfair is investing heavily into its proprietary logistics network, its technology and the supplier and customer experience. (Exhibit 1)
Exhibit 1: Wayfair invests to build customer loyalty
Source: The Equity Analyst
“To make customers sticky and more loyal to the Wayfair platform ….[that’s] really what is at the heart of Wayfair’s strategy. Those investments in supply chain, merchandising, selection, availability, service, all translate into customers being willing to pay more for a product they see on Wayfair’s platform.”
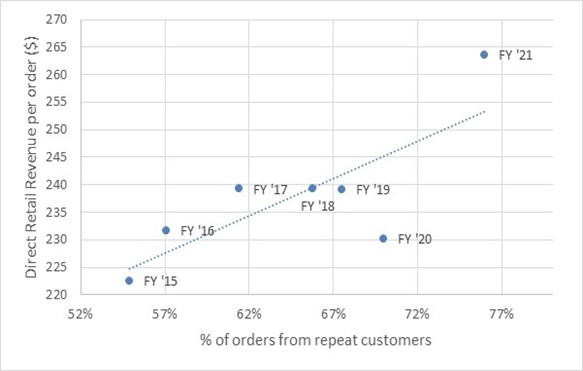
As can be seen in Exhibit 2 below, the investments Wayfair is making to engender loyalty are translating into a steady rise in orders coming from repeat customers – a metric that has shown uninterrupted growth from 55% in FY ’15 to 76% in FY ’21. This is significant given the number of active customers has grown from 5m to 27m between this time, roughly indicating Wayfair’s loyal customer base has increased 7-fold, from 2.9m to 20.5m[2].
Also in Exhibit 2, it can be seen that Wayfair has capitalized on this increasing loyalty to selectively increase prices, as reflected in the positive trend in average order values.
Exhibit 2: Wayfair selectively increases prices on a growing base of less price-sensitive, loyal customers
Source: Company filings
Cost of Goods Sold is made up of Product Costs (80%) and Shipping and Fulfilment costs (20%) (Exhibit 3). As such, falling Product Costs will be the largest driver of reducing COGS.
Exhibit 3: Product Costs make up the majority of COGS
Source: Company filings
Product Costs are made up of the amount Wayfair owes suppliers for goods as well as inbound shipping costs – the cost to get the goods from the suppliers’ warehouses to Wayfair’s fulfilment hubs. Both costs benefit from scale:
Wayfair gets higher rebates from suppliers when it sells more units for them
Wayfair gets lower freight rates from shippers when it pre-books more container slots with them
To quantify Wayfair’s current scale, in FY ’21 it sent 80,000 containers on ships from Asia to the US and Europe, equivalent to a Top 20 importer into the United States. This figure is set to double in 2022 and is up 100% from 40,000 containers in 2020.
“In 2021… CastleGate Forwarding offered a safety net for many of our suppliers and moved more than 80,000 20-foot equivalent containers during the year… This year, we expect to roughly double CastleGate Forwarding volume, which makes us a significant player in this industry.”
– Niraj Shah, CEO of Wayfair, Q4 ‘21 earnings call, 24th Feb. 2022
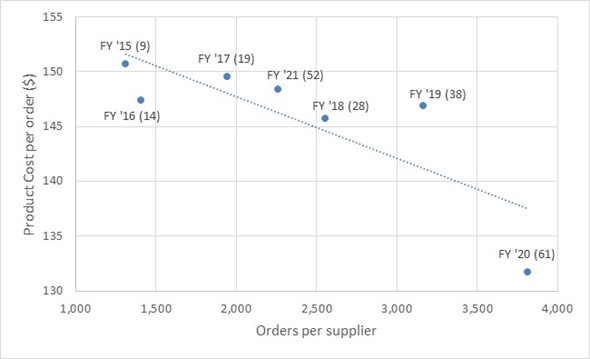
As we would expect based on these facts, as the number of orders per supplier has increased the Product Cost per order has decreased (Exhibit 4).
Exhibit 4: Growing orders per supplier, increases rebates, reducing product cost per order (total orders shown in brackets, millions)
Source: Company filings
It is worth noting that in addition to processing less orders in FY ’21 (52m) relative to FY ’20 (61m), reducing orders per supplier (2,261 vs. 3,813) supply chain disruptions caused freight rates to spike in FY ’21, which in turn drove Wayfair’s higher Product Costs per order compared to FY ’18, FY ’19 and FY ‘20.
Though Product Costs will be the main driver reducing COGS, it is also worth noting that Wayfair’s ability to leverage its scale to increase drops per last-mile delivery route (an outbound delivery cost) – and add more pick-ups of returns to these routes– should also support a reduction in Shipping and Fulfilment costs as a percentage of sales.
High margin ad revenues from retail partners have historically hidden this growth in GPMs
The combined effect of Wayfair’s dynamic pricing and volume-based rebates can be seen by comparing Wayfair’s Direct Retail revenue to its Cost of Goods Sold, while excluding the historic high-margin revenue Wayfair used to earn from third party retail partner websites.
Ignoring this historic revenue source, which fell to zero in FY ’20, we can evaluate the gross margins on Direct Retail revenues, which have shown steady growth since FY ’15 as a result of the reasons discussed above. (Exhibit 5)
Exhibit 5: Wayfair’s pricing power is obscured by GAAP gross profit margin
Source: Company filings
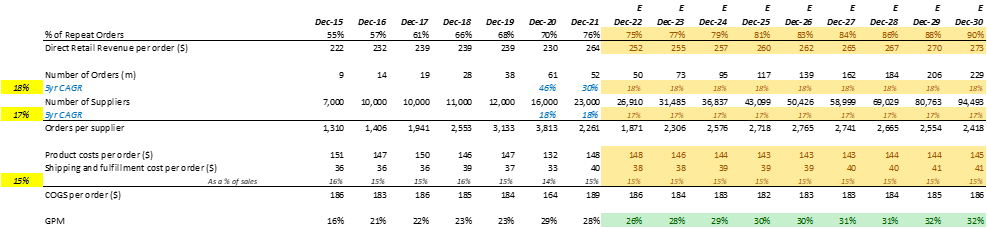
Appendix 1:Growing supplier count, repeat customer representation, with slower growth will drive gross margins to 32% by FY ‘30
Assuming:
Repeat orders continue to grow as a percentage of the total at the current rate, they will represent 90% of all orders by FY ‘30
Direct Retail Revenue grows in line with its historic relationship with percent of repeat orders
A slowing growth in orders from 30% CAGR over the past 5 years to 18% CAGR over the next 9 years will grow annual order count from 52m in FY ’21 to 229m in FY ‘30
A similar growth rate of 17% CAGR will increase supplier count from 23,000 in FY ’21 to 94,493 in FY ‘30
Product Costs per order grow in line with their historic relationship with Orders per supplier
Modelling Wayfair’s GPM expansion to 32% in FY ‘30
Source: Company filings, The Equity Analyst estimates
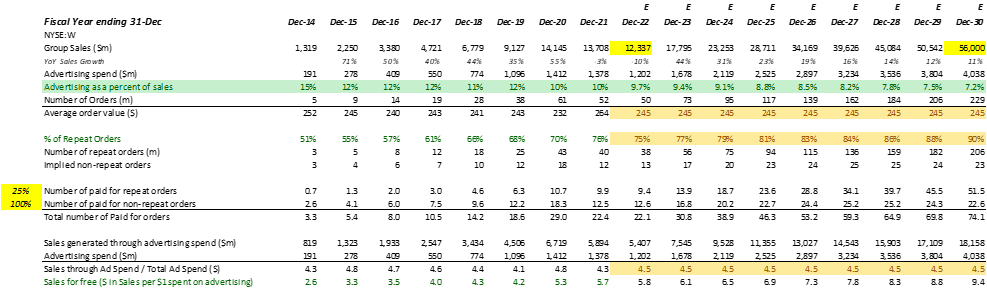
Appendix 2: Growth in the proportion of cheaper to solicit, repeat orders will compress ad-costs to 7% of sales
Repeat customers are more engaged, and ones that Wayfair has more up-to-date information on regarding their product interests. Therefore, through customer buy-in and more targeted marketing, repeat orders are cheaper on average for Wayfair to solicit than those from customers that have not shopped with Wayfair in the past two years.
Assuming:
Sales grow at a 15% CAGR over the next 9 years, significantly slower than the 40% CAGR over the past 7 years.
Repeat orders continue to grow as a percentage of the total at the current rate, they will represent 90% of all orders by FY ‘30
75% of repeat orders can be solicited through free mediums of advertising, such as email
The sales dollars generated from paid-for advertising remains at the historic ratio of $4.5 in sales for $1 in ad-spend
Then the proportion of revenue generated from free advertising methods will grow as a proportion of the total, reducing advertising expenses as a proportion of sales to 7% by FY ‘30
Modelling advertising expenses falling to 7% of sales
Source: The Equity Analyst estimates
[1] This assumes all active customers make the same number of orders each year. Repeat customers may well make more orders, but the point here is more about the growth and trajectory, not the exact numbers.
[2] Repeat customers are defined to be customers that shopped with Wayfair in the current and previous fiscal years. Repeat orders are those made by these customers.
Wayfair’s stock has been hit from multiple angles.
The home goods industry in which it operates is set for further contraction as rising food and energy costs divert consumer spending away from discretionary categories like furniture and home furnishings.
The industry has also seen sales shrink as consumers redirected their dollars to services like travel starting in late 2020, reversing their above trend spend on goods, induced by the lockdowns.
In step with the goods-to-services shift, the reopening of brick-and-mortar competitors has resulted in online players giving back the market share gains they made when non-essential stores were barred from opening.
Alongside these economic factors, the likelihood of further interest rates hikes has led to a wholesale derating of high-growth stocks, whose promise of large free cash-flows in the future now look less likely and are being discounted at higher rates.
Together, from March 2021 highs, these factors have sent Wayfair’s shares down 85%, to near March 2020 lows. Short-sellers, representing over 30% of Wayfair’s freely tradable stock, are having their day in the sun.
While momentum forces may continue to benefit these short-term-focussed bears, Wayfair’s prospects for expanding market share and margins present a business worth multiple times the current $5bn market value.
The home goods industry is dominated by intermediaries that connect suppliers with customers. About 80% of sales still go through high-street shops, which constrained by inventory storage costs, concentrate their volumes across a limited number of SKUs to strengthen their bargaining power over suppliers. This forces them to focus on specific customer groups.
Suppliers, which manufacture sofas, beds, gazebos, etc. don’t benefit from brands and hence rely on these intermediaries to reach customers.
Customers in turn select goods based on price and their personal style, and select an intermediary that can provide these two with efficient delivery and returns.
Wayfair, an intermediary, was founded in 2002 with the premise that it is quicker and cheaper for customers to find home goods online, rather than travelling to shops. Wayfair’s customers can view products that its suppliers own, and that Wayfair can deliver to them. As such, unlike high-street shops, Wayfair doesn’t incur upfront costs to buy and/or store inventory, enabling it to sell products targeting a far broader spectrum of tastes and income-brackets, all while freeing up cash and avoiding inventory obsolescence risk.
Together this has facilitated Wayfair’s rapid growth to become the largest online seller of home goods in the US and UK, the first two markets it entered, as well as gaining share in its other markets of Canada and Germany.
Overall growth has been supported by home goods consumers shifting their spend online – category penetration grew from c. 5% in 2011 to c.20% in 2021, a 15% CAGR.
But Wayfair’s market beating sales CAGR of 40% since FY ‘14 is indicative of its superior offering for suppliers to sell their products online, and for customers to buy from. When paired with the fact that FY ’21 sales of $14bn represents c.2% share of the growing furniture, home furnishings, appliances and garden equipment market it targets, this suggests a major portion of Wayfair’s growth lies ahead.
For suppliers, Wayfair provides access to huge customer traffic – 4bn site visits in 2021- plus end-to-end delivery of their goods, for no fee.
In return, suppliers offer their products to Wayfair at wholesale prices, with Wayfair incorporating its costs to acquire, retain and deliver to customers in setting the retail price.
Suppliers can thus boost sales in a low-risk way; outsourcing the costs of website development, maintenance, advertising and delivery. This has incentivized more suppliers to sell more items through Wayfair.
Specifically, Wayfair has grown from having 7,000 suppliers each offering 1,000 SKUs on average in FY ‘14 to 23,000 offering 1,400 in FY ‘21 – creating an enormous assortment of 31M SKUs for customers. By comparison IKEA only offers 9,500 SKUs.
This broad selection benefits customers of all tastes and income brackets, who also benefit from Wayfair’s reinvestments into its proprietary logistics capabilities, which reduce delivery times and the retail prices Wayfair can offer. Increasing numbers of new and higher-spending, repeat customers, further incentivizes more suppliers to join thus further increasing selection, positively reinforcing the virtuous cycle.
To emphasise the power of this platform, its worth noting that the 10x growth since FY ‘14 in sales and active customers (27M FY ’21) has not been on the back of lax promotional or advertising spend.
Between FY ‘14 and FY ‘21, gross margins have actually expanded from 24% to 28% while advertising expenses as a percent of sales have gone down from 15% to 10%.
Through higher utilization of its logistics network plus growth in higher margin supplier services such as merchandising and advertising, future sales growth will likely be paired with gross margins expanding to c.30%. Advertising spend will likely continue falling to 7% of sales through brand-development and a larger share of cheaper, repeat business.
College room-mates and co-founders, Niraj Shah and Steve Conine remain in charge and the largest shareholders – each owning 13%.
While strong competitors such as Amazon and Walmart are also developing their 3P online home offerings, they sit alongside Wayfair as platforms consolidating assortments and benefitting from the consumer transition online. By investing to boost supplier sales and customer experience, these platforms are raising supplier switching costs and industry requirements to compete.
Wayfair’s current valuation prices a 2008-style contraction in its existing markets, continued shift in spend online, but no market share gains for Wayfair within online.
Planned expansions into adjacent European markets of Ireland and Austria and potentially more, will expand Wayfair’s TAM, as could sales of its 3D digital furniture images in the Metaverse.
Wayfair’s strengths over its weakest competitors should enable its market share to grow from 2% to 8% by 2030 –sales growing from $14bn to $56bn in 8yrs, at a 19% CAGR. Expanding margins should boost free cash flow yields from 1% to 5%.
A business producing $3bn in FCF in 2030, with room to grow, might well have a market value $40bn or more – that’s 8-times the current $5bn price in 8 years, presenting investors 30% CAGR potential over the period.
If Shah and Conine hit their $100bn 2030 sales target, the upside is doubled, Short-sellers should savour the short-term, as falling prices appear to be attributing ever smaller amounts to Wayfair’s long-term growth prospects.
If it can maintain its rapid growth and profitability, it’s a bargain
HelloFresh (XTRA: HFG) provides meal kits to customers in 16 countries and has grown sales at a 5yr CAGR of 60%! In absolute terms, sales have grown from €600m in 2016 to €6B in 2021. It currently has about €350m in Net Cash on the balance sheet and a market value of €6.3B. One reason for my initial interest was if the business could maintain even one-third this growth rate, and become consistently profitable, it was probably worth at least 5-times as much[1].
Like others in its industry, HelloFresh has grown by spending money on marketing to acquire new customers in new and existing markets. Customer count grew from 1m in 2016 to 7.2m in 2021 (€6B 2021 sales = 7.2m customers x 16 orders per year on average x €51 spend per average order).
In addition to this rapid growth, what also attracted me to the business was what looked like strong cost-controls and economies of scale in the model. This was reflected in their Gross Margins having steadily grown from 52% in 2015 to 66% in 2021.
But low barriers to entry have enabled an influx of new entrants that erode its sales growth potential
Despite these facts, it’s hard to contend with the competitive threats the business may face in the years ahead. They are operating in an industry with low barriers to entry (search “meal kits London” you’ll see Gousto, minfulchef, planty, Zested, Dishy, FeastBox – and that’s just Page 1 on Google).
What lowers the entry-cost for competitors is the fact that they don’t need to compete with HelloFresh in every country they are in, they can just choose to compete in say, London or New York – therefore only having to allocate marketing spend to that country. In addition to “meal-kit only” competitors, restaurants and supermarkets are also now offering meal kits – so HelloFresh’s menu is now also competing with chefs at Michelin star restaurants (dispatch.com specializes in this niche), Morrisons Eat Fresh and Cook with M&S Recipe Box.
The value for money they boast about offering may prove to be fleeting and a hinderance
Furthermore, while HelloFresh might be able to negotiate discounts on fresh ingredients for its meals, because it buys at scale, those discounts are country-specific because as their name suggests they need “fresh” ingredients, and they are unlikely to be able to leverage the cost advantages of single-sourcing across their global distribution network. This means that if HelloFresh does have any economies of scale, they are “local” not “global” and therefore any competitor that has sufficient scale in a particular region will be able to compete aggressively with HelloFresh on price. Here the Morrison’s and M&S offerings concern me.
Furthermore, the company mentioned they are also working to keep prices low for their customer base despite rising costs of ingredients, which will weigh on their gross margins. In their latest earnings call CFO Christian Gaertner stated that their price increases have been “meaningfully lower than the food price inflation we see in all markets”. The price HelloFresh pays for their ingredients has gone up 4%, but they have only increased prices by 2%.
It doesn’t provide me with the predictability of free-cash flow production I demand
As a result of these threats, there’s a reasonable probability the business will burn through all the cash it brings in just to maintain its market share, which would make it worth far less today. Furthermore, even as it grows, the business doesn’t appear to be making it harder for competitors to steal customers from them, which is a big problem when a lot of new competitors have already entered their markets.
In all, these create the conditions in which it is hard to say with confidence that the 3-5 year outcome of investing in this business will be positive, and therefore a risky proposition for a concentrated portfolio.
[1] 6B in sales growing at 20% CAGR gets to 21B in 7years, assuming 7% operating margins and 20% tax, that’s 1.2B in after-tax operating earnings by 2028. Taking a 8% discount rate and 3% Terminal growth rate, and adding the 300m in net cash, you get an equity value of 29B – 5x the current 6B market cap.
I am selling out of Playtech because I have found evidence to suggest Playtech’s core business-to-business (B2B) software product, “IMS”, is not as powerful in increasing the revenues of its online customers as I previously thought.
Background
I bought shares in Playtech in April and July 2020 at an average price of £1.94. The investment thesis underlying the purchase was based on two key results materializing over time:
Playtech’s “core” B2B business (excluding B2B revenues from Asia) would grow at 7% CAGR over the next five years as a result of the strength of Playtech’s value proposition to gambling operators; both, reducing costs and increasing revenues for them.
Playtech’s Italian business, Snaitech, benefiting from Playtech’s powerful IMS technology would drive 15% CAGR in Snaitech’s online offering and thus enable 7% CAGR of cash flows in the Snaitech business overall.
In both cases, the investment case relies heavily on the fact that Playtech’s technology is superior to competing offerings in the market. A fact that Playtech management reiterates at every chance they get – annual reports and regulatory filings are littered with affirmations of Playtech being “the leading technology company in the gambling industry”.
Why did I initially believe Playtech’s technology was actually great?
The evidence I based this judgement on came in the form of a few separate data points:
The idea that they had collected specific player data over the past 20 years and that this could be used to target players with specific bets (and thereby increase operator revenues) made intuitive sense to me.
In discussions with Playtech’s investor relations team they described this ability as being analogous to “how Netflix recommends videos to you” (a vivid image, which powerfully secured itself in my decision making).
Headline data points supported the fact that Playtech’s B2B business was growing in line with global online gross gambling revenues (GGRs).
When William Hill tried to move off Playtech’s platform in 2014 their revenues plummeted and they signed back up with Playtech in 2016
After GVC acquired Ladbrokes-Coral in March 2018, and weighed up the benefits of moving L-C off Playtech’s technology, they decided against it and in fact extended the contract with Playtech.
Reading the above list, it can be seen why I might have thought Playtech was a business benefitting from a durable competitive advantage in the form of a rich dataset that enhances revenues for operators and may well benefit from “network effects” – as it increases revenues for operators it collects more useful player data making its offering even more powerful, and thus generating even greater revenues for its customers, creating a virtuous cycle. And given Playtech collects a revenue share from its operator customers, this created what I believed to be a stable business model that could endure, and get stronger, over time.
The insight
When operating in a world in which we are inundated with information, finding an answer you want is far easier than it has ever been. This can cause us (me!) to quickly latch on to evidence that supports the conclusions we hope to be true. As a result of this proliferation of information, I think now, more than ever, an ability to ask the right questions is far more valuable than the ability to find answers to your questions, and I expect the relative importance of these two to continue to widen going forwards.
So it follows that a key insight that caused me to change my mind on Playtech came as a result of spending time looking deeper to answer the right question. And that question was:
“If Playtech’s software really does increase online revenues for its licensees then what else would we see?”
Points 3, 4 and 5, above, appear to answer this question to some extent, but more specifically because Playtech’s revenue was a share of the net revenues its licensees were generating, I should have seen Playtech’s revenues from providing this “Netflix”-style offering growing at a rate that was faster than the market – if they were growing in line with or slower than the market then Playtech’s offering can’t be much better than average.
The challenge
If this were easy to figure out then of course I would have probably figured it out a lot sooner. The challenge with Playtech comes in trying to dissect what revenues are coming from which product verticals. Part of the reason it is difficult to do this (and close to impossible to do precisely) is because the segment presentation of revenues has been changed no less than three-times between 2014 and 2020 (2016, 2017 and 2019). This makes it difficult to answer even a simple question like “how much revenue has Playtech historically created for its licensees online”.
My goal was to figure out how much revenue Playtech was generating from providing online games to gambling operators supported by Playtech’s IMS platform, which provides the targeted bets that cause players to engage in more bets and thus increase revenues for operators.
The finding
What I found was that the revenues being generated from Playtech’s online operations, which were being benefitted by IMS were failing to keep up with the market growth overall. A more detailed look into my work in this area can be found in the attached Appendix.
For a technology that is supposed to be “leading” we would typically expect the performance to be better than average, not below average. This has led me to conclude that at a minimum, Playtech’s IMS platform and its ability to increase licensee revenues is not anywhere near as powerful as I first thought.
This was an analytical error on my part.
Some thoughts to ensure I’m not selling something I shouldn’t
There are many types of mistakes an investor can make and in this instance I am concerned with one error in particular:
Selling something I shouldn’t
There is tendency for market participants to sell out of stocks after strong price increases similar to those we have seen in the past year (2020). Some explanations for this behaviour are fear of losing paper profits and a form of market “altitude sickness” where participants ask some variation of the question, “It’s already gone up this much, how much further can it go?” However, while Playtech’s price rise has been strong, I wouldn’t call it meteoric and therefore I don’t think these factors are at play here.
Nevertheless, in the same way I engage in “pre-mortems” when making a purchase decision, I also engage in this exercise when selling out of a stock. I’ll discuss this next.
The pre-mortem
A pre-mortem is said to be one of Daniel Kahneman’s (Nobel-prize winning behavioural psychologist) favourite tools for decision making.
A pre-mortem entails (i) projecting a current decision choice into the future and assuming it leads to a catastrophic failure, and then (ii) writing up one or more narratives that might lead to the disastrous outcome.
Not only does this exercise temper any overconfidence in ones choices, it also helps highlight any potential blind spots that might not have been given due attention in the decision making process. So let’s give it a go.
Suppose we sell out of Playtech stock at the current price of £4.51, but the price continues rising to near £8 over the next year. We missed out on this c.60% hypothetical move up, what set of business developments may have led to this price increase?
Positive developments in the US
Playtech has long talked about the power of its Sport-betting technology; pointing to anecdotal examples of its machines generating higher gross margins for operators than a competing product offered by Novomatic in Austria. Playtech may boost its revenues by selling large numbers of gaming machines to gambling operators and sports bars in the US market.
“Marketplace” starts showing signs of becoming a powerful two-sided ecosystem for finding and distributing gambling games.
The Marketplace offering is a 2-sided platform that has come about through Playtech’s heavy R&D spend, which is said to allow third-party games manufactures to sell their games into Playtech’s over 150 licensees and for licensees to access not only Playtech’s games but also those provided by third parties.
This would manifest itself in the form of growing Casino or Services revenues, neither of which we have seen thus far.
I plan to monitor developments in these areas for Playtech going forwards.
Closing thought
A question that may come to mind is “given the growth potential from the opening up of the US sports betting market, why not just continue holding on to Playtech while the price is rising?” The fact that so many states are heavily indebted and are open to using gambling tax as a source of revenue to plug the holes may well provide a powerful tailwind for online gambling companies.
The answer to the question really lies in the fact that there will inevitably be some surprises up the road for Playtech and, as we have seen in Playtech’s recent history with the deterioration in its Asia revenues, not all these surprises will be positive. Durable competitive advantages protect a business’s operating cash flows from these negative surprises and in this case I appear to have numerical data that indicates that Playtech does not benefit from as strong a set of competitive advantages as I previously thought. It’s for this reason I am selling Playtech.
Appendix 1: The confusion
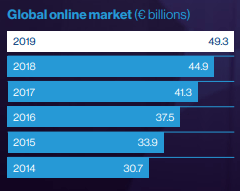
On page fourteen of Playtech’s FY ’19 annual report, a bar chart is displayed demonstrating the growth of the global online gambling market, this is shown below in Exhibit 1:
Exhibit 1: Playtech points out that the global online gambling market has been growing at 10% CAGR
Source: Playtech FY ’19 Annual Report, p14
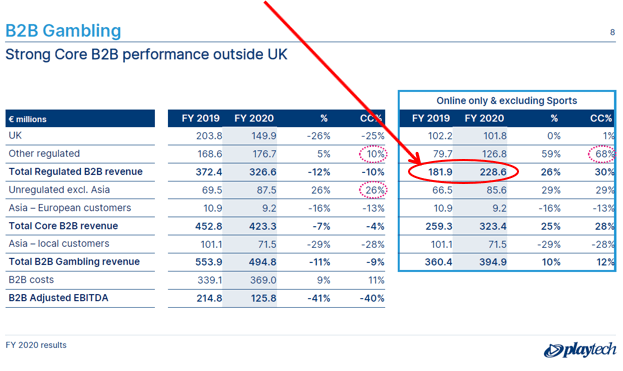
In order to get a feel for the power of Playtech’s IMS technology (“Netflix style” bet-recommender) we need to compare all the revenues Playtech is generating as a result of its “Netflix style” IMS bet-recommender technology relative to this market growth. This is given by taking all the “Gaming B2B revenue” less the revenue being generated in Asia (“Asia B2B revenue”) which is “content-only”. I refer to the residual as “Core B2B revenue”, as can be seen in Exhibit 2 below:
Exhibit 2: Core B2B excludes revenues that don’t benefit from “bet-recommender” technology
Source: Company filings
Immediately not great; it appears the Core B2B revenue has been growing slower than the market overall (9.7% vs. Global Online GGR 5yr CAGR of 9.9%).
Total Gaming B2B revenue is made up of revenues from supplying Casino games, Sports betting technology, Bingo games, Poker games and “Other” to gambling operators, and we know from past reports that 100% of Asian B2B revenue is from supplying only online Casino games (“content only”) to Asian operators – no powerful IMS back-end, bet-recommender technology.
The problem is, even excluding Asia, it’s not clear how much of this “Core B2B revenue” is from providing its technology “online” versus how much is from providing its services to “offline” customers. For example in the Sports vertical, in addition to providing some technology for online sports-betting, Playtech also provides sports betting machines to gambling shops and generates revenues on the sale of these machines i.e. offline.
This is an important distinction to make, because the Netflix-style “bet-recommender” technology which is supposed to increase revenues for gambling operators is purely online; it doesn’t increase the revenues made on betting machines in betting shops. And given an estimated 80% of UK betting shops use Playtech’s sports-betting Self-Service Betting Terminals (SSBTs), the “Sports” line item is probably highly skewed towards revenues from retail shops.
So I needed a “clean” measure of “online” revenues. The closest thing I could get to “pure online” revenues was to estimate Core B2B OnlineRevenue historically. Luckily for us, for the first time in Playtech’s history, management provided a figure for this in their March 2021 FY’20 presentation, as can be seen in Exhibit 3 below.
Exhibit 3: Playtech provides a Core B2B Online Revenue estimate for FY’19 and FY’20
Source: Playtech FY20 Results presentation
The c. €182m figure for FY ’19 provides an output for me to work with, and thereby estimate this figure historically using segment level data provided in historic annual reports, by assuming:
Virtually 100% of sports revenues come from retail sources (SSBT machines), and
Playtech’s revenues from the Casino (ex. Asia), Poker, Bingo and 50% of “Other” are online and benefiting from Playtech’s IMS technology.
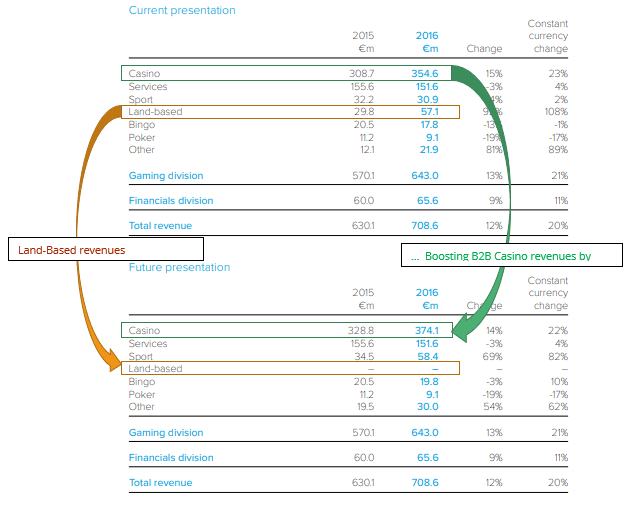
Having read nearly all of Playtech’s filings over the past five-years I believe both of these I are very likely to be accurate. Furthermore, I assume that c. €20m in Casino revenue from 2015 onwards is from “Land-based” sources, as a result of reporting changes the company made in that year, as shown in Exhibit 4 below.
Exhibit 4: Casino revenues from FY ’15 onwards includes revenues from Land-Based casinos
Source: FY’16 AR, p.39
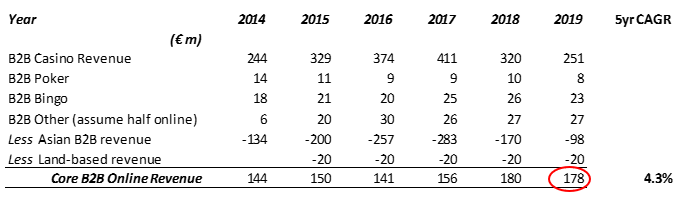
Adjusting for these “Land-based” revenues and omitting Asian B2B revenues, my estimate of FY ’19 “Core B2B online” revenue of €178m (Exhibit 5) can be seen to be very close to Playtech’s own figure of €182m in Exhibit 3.
Immediately we notice that the 5-year compounded growth rate for the Core B2B Online Revenue has materially underperformed the market as a whole (4.3% CAGR vs. 9.9% CAGR, Exhibit 2), indicating Playtech has in fact been losing market share online.
The most obvious question then is,
“If Playtech’s online offering is a ‘leading’ technology and truly superior then why has it failed to keep up with the market growth?”
This evidence suggests Playtech’s online offering is not quite as powerful as management were making out and that I previously thought.
Stabilus (XTRA: STM), is the world leader in the manufacture of gas springs and motorized opening and closing systems with a market cap of €1.5bn. The stock currently represents about 5% of my portfolio, with the potential to deliver about an 14% rate of return over the next decade, which is a sound rate of return.
Investment Thesis
While I believe Stabilus’s dominance in its niche is well-understood and appreciated, what I think the market is undervaluing the option value in the business should there be a materially positive development in the world of Mobility as a Service, or RoboTaxis, where we will be able to sit in a car with no driver, go to sleep and wake up safely at at our destination. I think we’re now at a stage in the development of the technology where we see this type of Level 5 automation on the roads by 2025 with triple digit growth in the adoption of the technology in the first five to seven years thereafter.
So lets now have a deeper look into the business. Stabilus reports under three segments Gas Springs and Powerise, which sell to automakers and Industrials which sells into Industrial customers. I’ll start by talking about Gas Springs because this is where the business started.
History
Stabilus is a German manufacturing company that was founded in the 1930s, but its current business model really started to take shape in the late 1960s when the first hatchback cars came about. One trait about these hatchbacks which differentiated them from the traditional sedan or saloon cars was that they were hinged at the roof rather than at the bottom of the back window. This meant that rather than the just the metal trunk-lid rising up, the back glass panel would also go up with the metal boot, and cars with this feature were said to have a “tail gate” at the back as opposed to a “trunk lid” at the back. This is were Stabilus came into play.
Because a tailgate has to carry the glass panel, while trunk lids don’t, tailgates are far heavier- weighing somewhere between 30-40kg (about 80 lbs) depending on the car- that’s enough weight to break a child’s hand if that tailgate fails to stay up in an open position when it should.
Naturally automakers wanted to find a cost-effective solution but with the potential public liability risk and reputational risk on the line if there was a situation where an end consumer got hurt, the quality and reliability of this solution is far more important then the price they had to pay.
And since the 70s there has only been one technology…
…that has been adopted by automakers, which are gas springs, and Stabilus holds the global monopoly on these with about 70% market share which is 15-times bigger than the number 2 supplier.
Gas Springs are metal struts usually varying between 60 and 70cm long, containing pressurized gas and the length of these tubes and the pressure of the gas within them are unique to the weight burden of the application – a Land Rover requires difference gas springs to a Volkwagen Golf.
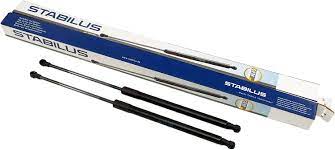
Exhibit 2: Stabilus operates a monopoly in gas springs, 15-times bigger than No.2 player
Source: Stabilus
Low cost item for automakers
Stabilus was not only able to consistently provide the automakers with gas springs with zero gas leakage, but was able to sell it to them for €3 each – making it one of the cheapest of the 30,000 components that go into making a car, making it a low priority item for automakers when it comes to price negotiations.
Slow growth market…
In addition to this dominance, Stabilus operates in a market with limited growth potential – annual light vehicle production is about 90m cars and growing about 1-2% per year and even if we account for a continued decline in sedan cars and an increase in Stabilus’s addressable market of cars with tailgates you’ve got an addressable market for gas springs growing at about 4-5%.
…which creates a barrier to entry
This dominance in a slow growth market creates a barrier to entry for anyone looking to displace Stabilus. Specifically, the hundreds of millions of euros a competitor would need to spend to design and replicate Stabilus’s proprietary production machinery would be a low return investment because there’s no real market growth to capture and its unlikely they’ll be able to displace Stabilus’s customers from them.
So Stabilus’s Gas Spring segment, which represents about one-third of group’s €1bn in annual sales (about €350m in FY19), is a business with an extremely durable competitive advantage. But given Stabilus already has such a large market share in this space, growth is limited by market growth which is about 5%.
Industrial applications
But with these same gas springs, manufactured with the same equipment, Stabilus found that they can also be equally useful in a number of industrial applications from office swivel chairs to hospital beds to reducing the vibrations on solar panels.
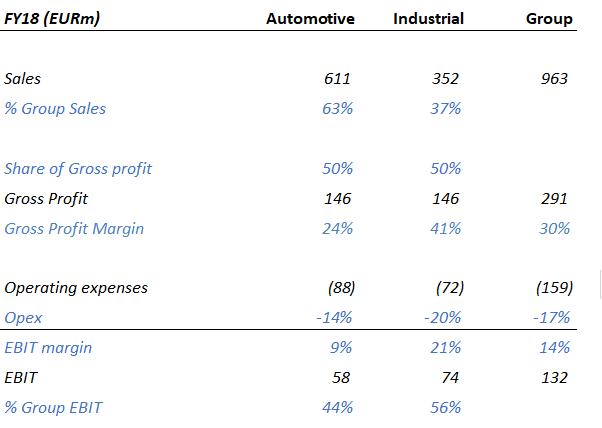
But given these industrial customers buy in much smaller batch sizes relative auto makers, Stabilus are able to sell these gas springs to industrial customers at higher prices and margins, such that the Industrial segment operates with 25% EBIT margins vs 8% EBIT margins in the Gas springs segment. As a result of these higher margins the Industrial business while accounting for only 40% of group sales, accounts for 60% of group FCFs.
Exhibit 4: Stabilus earns higher margins on its industrial sales
Source: The Equity Analyst estimates
Economies of scale
Because the same production machinery is used to produce auto and industrial gas springs, fixed personnel costs related to production can be spread over more units, reducing the cost to produce each unit and manifesting itself in expanding gross margins.
Industrial growth – 7% organic, 15% headline
While the Industrial business line has been growing organically at about 7% the headline growth has been about 15% due to acquisitions. We might well see a similar level of headline growth going forwards given the long tail of smaller industrial gas spring competitors, but this creates the risk of value destruction through overpaying, which is something I’m monitoring.
Summary up to now – Industrial 40%, gas springs 35%
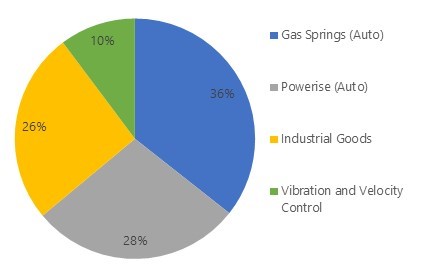
So we have a company with about €1bn in sales, 40% of which comes from selling gas springs to industrial customers and 35% of which comes from selling gas springs to automotive manufacturers. The last 25% is where I see the vast majority of growth coming from and that’s from the supply of Powerise, Stabilus’s motorized opening system to automanufacturers.
Exhibit 5: Revenues by segment, 2019e
Source: Company filings
The Powerise market and value-add to its ecosystem
It’s likely you’ve already seen a Powerise motorized strut in action. About 15% of all cars now open and close with the click of a button or by waving your foot under the car. This is not only more convenient but the sensors that come with this technology stop a boot from closing on a passengers hand, making it safer. In addition this is a feature that car makers love right now because they can buy a Powerise system from Stabilus for about €50 and sell it on as an add on feature or as an inbuilt feature in their cars for about €500. So if we look at the Powerise ecosystem; Stabilus earns about 13% EBIT margins which is decent, the end consumers like the convenience and safety and the automakers are currently earning a 90% margin on this feature.
If we look at the growth trajectory of similar convenience features in cars like heated seats and cruise control I wouldn’t be surprised if this penetration rises from 15% to say 30 or 40% in the next five to six years creating growth of 15-20% in this segment. And given the Powerise segment has grown at a 30% CAGR in the 6years to 2019, this 15-20% forecast may prove conservative.
In addition to the growth potential in vehicle tailgates, we have seen Tesla adopt Stabilus’s Powerise system in their gull wing doors on the Model X. Whats worth noting here is that each door requires 3-4 Powerise devices versus just 1 or 2 in a tailgate. This means that the Tesla Model X, with 2 gull wing doors, has about 8-times the number of Powerise devices in it relative to the average car.
Now you might say, well, but we’re not going to see all cars with gull wing doors, but four other auto makers have put in orders for Stabilus’s door actuator technology, according to management and part of the reason is automakers are preparing for the rise of MaaS or RoboTaxis.
Mobility as a Service requires automatic opening and closing doors because the service can’t be reliant on passengers behaving responsibly and closing doors and boots after themselves.
Autonomous driving technology is developing steadily
Developments in the space are happening quickly. Take for example the fact that the average human drives about 10,000 miles per year and for about 50 years of their lives, without incremental improvement. By contrast Waymo, Google’s autonomous driving unit has 20m recorded miles on its technology. And if you think that’s a lot, Tesla’s Auto Pilot technology which updates everytime any driver of any Tesla takes back over from AutoPilot mode to note the reason for the intervention, has built 3bn miles, And if we just take the 500,000 incremental units Tesla sold in 2020, and assume just 10% of the 10,000 miles these drivers drive in 2021 are on AutoPilot mode this 3bn rises by 500m on just the new cars sold in 2020. There is already strong data that on certain types of road autonomous driving is already far safer than human drivers.
I estimate that we will see the first autonomous vehicles on the road by 2025 and see triple digit growth in the first few years thereafter. In terms of current addressable market, if we take the number of regular drivers reported by the largest ride hailing companies, we have 4m at Uber, 11m at Didi, 2m at Oyo cars, then you’ve got the Lyft in the US. Grab and Go-jek in S.E.Asia, Cabify in South America and the list goes on. In total you’ve probably got about 30m cars that could benefit from driverless cars.
Conclusion
Stabilus is a business with €1.5bn market cap that is worth about €2.3bn and has the potential for 9% FCF growth without MaaS. So assuming a contraction in this 50% discount and adding on a 9% growth rate we could well get a 10 year CAGR on invested capital of about 14%. And if mobility as a service takes off and expands the addressable market for Powerise this long term IRR based on an investment today could rise to the high teens.
The mining industry downturn began in 2013, but has been showing signs of recovery since early 2017. Industry experts point to declining ore-grades and an improving mining investment cycle as favourable factors for the future of mining consumables manufacturers such as Mincon (LON:MCON).
The market has not been blind to these positive factors. Mincon’s share price is up 120% since Jan16 and shares in other market operators such as Sandvik, and Atlas Copco have also had a similar boost.
Currently, the market is pricing continued growth in Mincon’s business. It has a market cap of €395m on €12m of 2018E earnings. This valuation roughly prices in 20% compounded growth over the next five or six years.
Mincon is a drill bits manufacturer and distributer supplying primarily to the mining and construction industries. It is an acquisitive business operating in a fragmented market space. Its sales have grown at 20% CAGR and the business has a large family-founder ownership (56%). The 20% sales CAGR, however, is mostly inorganic. Contracting operating margins have caused its operating profits to grow at a much lower rate of 2%, with returns on capital of about 15%.
Mincon supplies to the Mining, Construction, Waterwells, Geothermal wells, Oil and Gas, and Coal Bed Methane industries. The mining industry is by far the largest customer, and due to the long planning cycles in that industry, customers tend to be focused on buying high quality drill components whose durability and efficacy will pay out over the life of the project. The orders from these mining customers also tend to be far larger in value than the orders from the others. The other customers, especially construction, tend to be price focussed due to the “one-off” nature of their projects.
The drill bits Mincon produces tend to be generic fitting, thus a Mincon bit can fit onto a Sandvik drill. When customers become price focussed the manufacturers lose pricing power.
Of late, there has been a consolidation of the players in the mining industry. One consequence of this has been a customer base that has been demanding better pricing on its large orders causing Mincon’s recent sales to these customers to be at tighter margins. While miners need drill bits to operate, and these are a small cost relative to their overall project costs, they don’t need to buy these from Mincon and they are actively working to manage their costs currently.
The two key elements of a long thesis on Mincon are:
Larger acquisitions going forwards driving sales and
Operating margin expansion.
Mincon have been selectively acquiring businesses that they know and the highly fragmented nature of the drill bits industry should provide ample opportunity for them to make further acquisitions going forwards, thus increasing sales.
Mincon has seen its operating margins contract from 26% in 2013 to 11% in 2017. While the commodity downturn is partly to blame for this, the cycle has turned, and other successful competitors such as Sandvik, Atlas Copco and Epiroc have all seen their operating margins expand since 2015.
In an attempt to widen its margins, Mincon has been shifting away from selling lower (gross) margin third party products and focussing on selling higher margin Mincon-manufactured products. The large acquisition of Driconeq however will dilute their efforts; the business will represent ~20% of Mincon’s total 2018e sales, but deliver half the gross margin of Mincon’s own manufactured products (25% vs 41% gross margins, respectively). While Mincon management have stated their expectations to widen the margins on this acquired business in the future, it’s not a certainty.
Mincon is a cyclical business, without any clear competitive advantages, growing through acquisitions in a highly fragmented market. At current valuations, I estimate Mincon is overpriced by at least 25%.
I would advise investors to exit Mincon at current valuations.
I believe Purplebricks is an interesting short with ~90% of downside.
The business offers a commodity product, at the highest prices in the market, in an industry with low barriers and dozens of new entrants.
Rapid adoption of its “Fixed Fee” model in the UK is being extrapolated into the Australian and Californian markets, which it only recently entered, while changes in the competitive landscape in the UK and Australia and idiosyncratic elements of the U.S. market are being ignored.
Thesis
Purplebricks (“PURP”) is a hybrid estate agent (online + offline) offering a “fixed-fee” service in the UK. The company has benefitted from aggressive advertising spend, which has created brand recognition. Positive recommendations from customers experiencing the advantages of a far-cheaper, fixed-fee online offering have also helped pushed the company’s valuation to greater than that of all other UK estate agents combined.
The bull case is based on a superior offering and growth runway. Fixed fees of c. £1,500 are cheaper than 2-3% on the average £250k sales price. The current penetration of online vs. traditional high street estate agents in the UK is ~2.5% and is expected to rise to about 20% by 2020.
But PURP is not unique. In 2016, almost all the c.50 online estate agents also offering “fixed-fee” products benefitted from this same tailwind of growing online penetration. While PURP’s share of online is close to 50% at present, this is likely to decline; the sheer number of competitors points to the low industry barriers.
Although PURP reports that it “completes on” ~88% of its instructions, my work scaping data from Zoopla and cross referencing the UK Land Registry website indicates PURP only sells about 35% of the homes it lists. This indicates they don’t have a superior offering to peers, but a commodity.
Furthermore, while many of PURP’s online competitors did not utilise Local Property Expert’s in the past, many including YOPA, Emoov, Hatched, House Network and Tepilo now do. Traditional estate agents including Countrywide are now offering a fixed-fee offering across 50% of its ~900 branches. This deteriorates the novelty of PURP’s hybrid offering.
In Australian, entered in Aug16, large incumbents such as L. J. Hooker have not waited to see if PURP’s model can succeed, and instead have responded quickly by creating a direct competitor, Settl. Several online “DIY” competitors also exist. Having already spent ~£3.5 in advertising in 2017 on its Australian operations, it is likely PURP will have to go over its £10m “maximum” it had previously stated. And given PURP’s recent £50m equity capital raising, it now has the cash to do so.
PURP announced its entry to the Californian market in Jun17 with a launch expected in H217. High commission rates in the U.S. of 5-6% provide a ripe opportunity for a low fixed-price provider. However PURPs model relies on licensing Local Real Estate Experts (“LREE”), who because of the high commission rates paid, will not be financially incentivised to leave the 5.5%+ commission model. LREEs are being drawn further away through the rise of “100% commission” brokerage houses like Real Estate Broker Services Inc., which provide infrastructure to agents for a fixed payment rather than taking 10%-50% of the commissions.